Wildlife Nomads · Play · Carrying Capacity Lab
Carrying Capacity: How Many Can a Habitat Hold?
Carrying capacity is the largest population an environment can support for the long term. Grow a meadow to its limit, run your own rabbit island, watch a reindeer herd overshoot and crash, and see where humans fit in.
By Cesar Medina, conservation biologist and former field ecologist · 7 interactive stops

What is carrying capacity?
Carrying capacity is the maximum population size of a species that an environment can sustain over the long term. Food, water, shelter and habitat space set that limit. Ecologists write it as K.
Every habitat has a ceiling. A meadow can only feed so many rabbits, and a reef can only shelter so many fish. When a population reaches carrying capacity, births and deaths balance out. The population growth rate then drops to about zero.
I remember having to study these concepts, and it was not fun. Pages of graphs and equations hid a simple, beautiful idea. So I built the lab above, where you can grow, crowd and crash a population yourself.
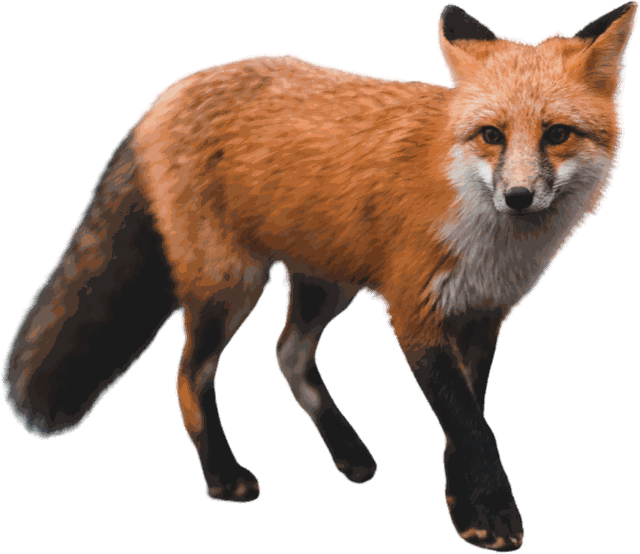
In simple words, carrying capacity is how many animals a place can feed and house without wearing itself out. Each species has its own carrying capacity in each place. A meadow that feeds 200 rabbits might only support a handful of foxes.
The biological definition of carrying capacity
In biology, carrying capacity is the population size at which the birth rate equals the death rate in a given environment. Ecologists describe it with the logistic growth equation:
dN/dt = rN (1 − N/K)
Here, N is the number of individuals, r is the growth rate and K is the carrying capacity. When N is small, the bracket is close to 1, so growth is almost exponential. As N approaches K, the bracket shrinks towards zero, and growth stops.
Belgian mathematician Pierre-François Verhulst published this model in 1838. Raymond Pearl and Lowell Reed rediscovered it in 1920 while studying the growth of the US population. Today it is a foundation of population ecology and environmental science.
For terrestrial species, ecologists often express carrying capacity as a density, such as kangaroos per square kilometre. It is never a fixed number, though. A wet year, a bushfire or a new predator can raise or lower it. That is why ecologists estimate carrying capacity from long-term population dynamics, not from a single count.
Exponential growth vs logistic growth
Every population starts with an exponential phase. With plenty of food and space, more individuals produce more offspring, and numbers climb faster and faster. On a graph, this makes a J-shaped curve.
No environment offers more resources forever, however. As numbers rise, food runs short, disease spreads and space fills up. Ecologists call this push-back environmental resistance. It bends the J into an S-shaped curve that levels off at K.
| Feature | Exponential growth | Logistic growth |
|---|---|---|
| Curve shape | J-shaped | S-shaped |
| Resources | Unlimited | Limited |
| Equation | dN/dt = rN | dN/dt = rN(1 − N/K) |
| Growth over time | Keeps speeding up | Slows, then stops at K |
| Real examples | Bacteria in fresh broth, a new invasive species | Paramecium in a tube, recovering seal colonies |
Interestingly, a logistic population adds the most individuals per year at half of its carrying capacity. Fisheries scientists build on this idea, called maximum sustainable yield. You can test it yourself with the “J vs S” sliders in the lab.
Limiting factors: what sets carrying capacity?
A limiting factor is any resource or pressure that stops a population from growing further. The scarcest resource usually sets the limit, an idea known as Liebig’s law of the minimum. In my rabbit island, you can watch K jump from grass to water to burrows as you move the sliders.
Here are five common limiting factors:
- Food availability: grass for grazers, prey for predators, plankton for filter feeders.
- Water: rivers, waterholes and rainfall, especially in dry country.
- Shelter and habitat space: burrows, tree hollows, nest sites and territories.
- Predators: predator–prey dynamics can hold prey well below what their food could support.
- Disease and parasites: both spread faster in crowded populations.
Ecologists also sort limiting factors by how they behave. Density-dependent factors, like competition, disease and predation, grow stronger as a population gets crowded. They pull a population back towards K. Density-independent factors, like bushfires, floods and cold snaps, strike just as hard at any population size.
Physical and chemical conditions matter too. Temperature, salinity, oxygen and soil nutrients all belong to environmental resistance. A fish in a warm, still pond can run out of oxygen long before it runs out of food.
What happens when a species exceeds carrying capacity?
Sometimes a population shoots past K. Ecologists call this ecological overshoot. It usually happens when resources respond slowly, so animals keep breeding after food has started to run short. Eventually, numbers decrease, sometimes gently and sometimes in a crash.
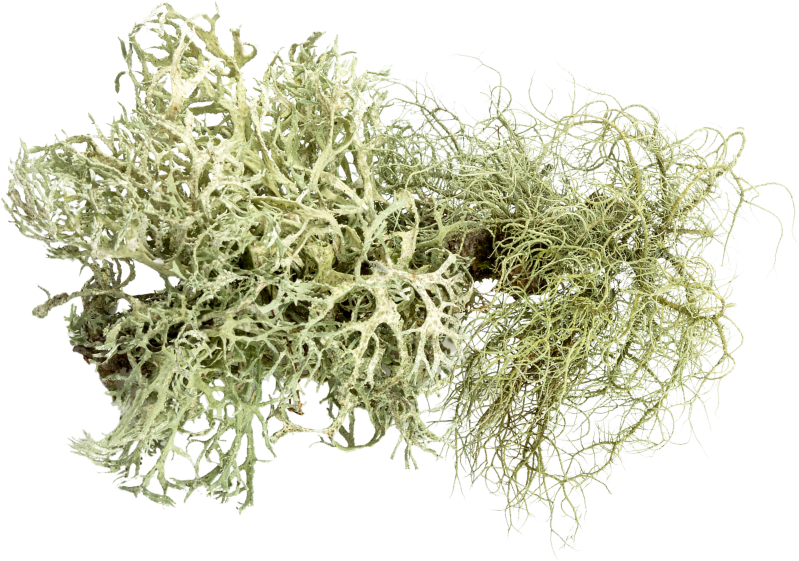
The classic example comes from St. Matthew Island in the Bering Sea. In August 1944, the US Coast Guard released 29 reindeer there. The island had no wolves and lichen mats four inches thick. By 1957, biologist David Klein counted 1,350 reindeer. By 1963, he counted about 6,000.
Then came the winter of 1963–64, with extreme cold and deep snow. By 1966, only 42 reindeer were left. Klein blamed overgrazed lichen combined with the brutal winter. A 2005 reanalysis argued that the winter weather was the all-important factor. Either way, the herd had grown huge with no predators. Then it lost about 99% in a single winter.
Why overshoot matters: a population that overshoots can damage the very resources it depends on. Overgrazed lichen, for example, takes decades to recover. The habitat’s carrying capacity can stay lower for years after the crash.
Carrying capacity examples in nature
Scientists have measured carrying capacity in organisms of every size. Here are four of my favourite examples:
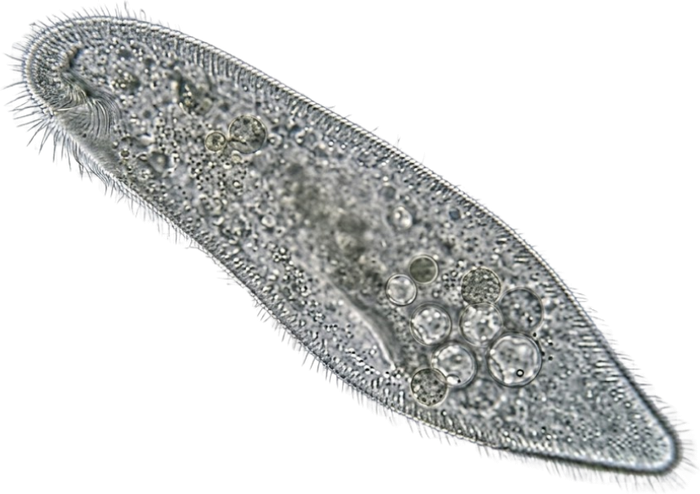
In the 1930s, G. F. Gause grew Paramecium in small tubes of nutrient broth. Their numbers rose quickly, then levelled off in an almost perfect S-curve.
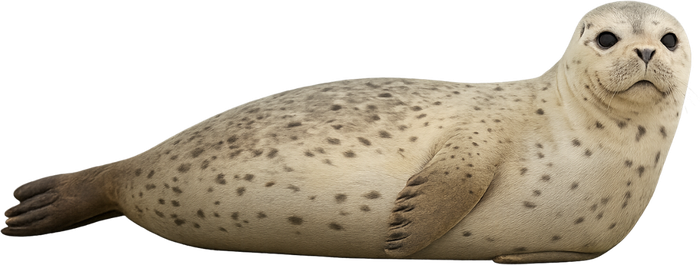
Seals recovered after bounties ended in 1960 and the Marine Mammal Protection Act passed in 1972. By 1999, counts were very close to the predicted carrying capacity.
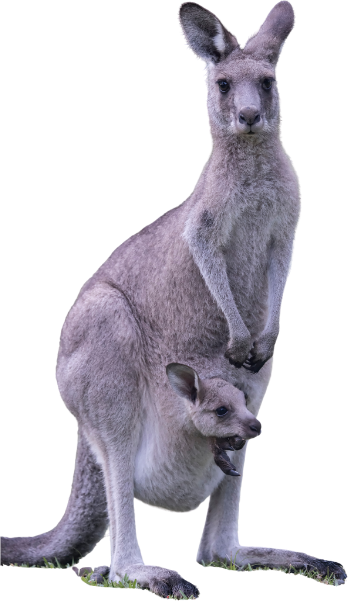
On Australia’s rangelands, kangaroo numbers climb after good rains and fall during droughts. Their carrying capacity rises and falls with the weather.
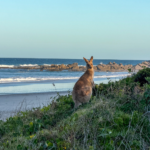
On my lap of Australia, I stopped at a huge open meadow in Coffs Harbour. It held so many kangaroos that I lost count. Seeing them graze, I thought about how much green grass a mob that size needs every day.
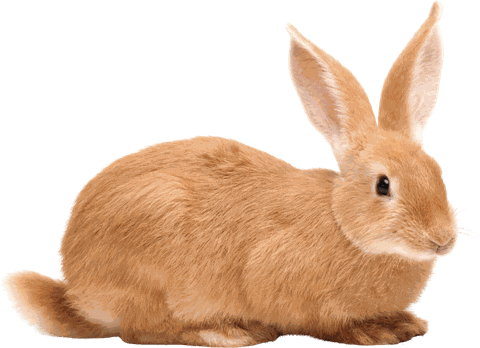
Rabbits tell the opposite story. About two dozen arrived near Geelong in 1859. With few natural enemies and endless pasture, they spread across much of the continent. In the 1950s, the myxoma virus cut their numbers by an estimated 95% in some areas. I still see rabbits along my lap today. You can read more in my guide to invasive species in Australia.
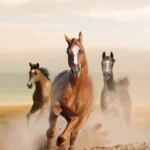
Introduced grazers can push a habitat past its limits, too. At Barrington Tops, I had to watch out for wild horses at both Polblue and Gloucester River campgrounds. Large herds of introduced animals with few predators can strip food and trample plants that native species need.
Human carrying capacity and population growth
Humans are the hardest case of all, because we keep changing our own K. For most of human history, the world population grew slowly. It reached about 1 billion people around 1800 and 1.6 billion by 1900.
Then human population growth exploded. Modern agriculture, industrial fertiliser, fossil fuels and medical care lowered death rates and boosted food production. The Haber–Bosch process, used industrially from 1913, turns nitrogen from the air into fertiliser. Today, synthetic nitrogen helps feed roughly half of all people.
The world population reached 7.8 billion in 2020 and passed 8 billion in 2022. The United Nations projects a peak of about 10.3 billion people in the mid-2080s, followed by a slow decline. Birth rates are already falling in most countries.
So how many people can the Earth support? In 1995, demographer Joel Cohen reviewed 66 published estimates of the human carrying capacity. They ranged from under 1 billion to more than 1 trillion. Half of them fell between 4 and 16 billion. The answer depends on our diets, our technology, the economy and how we want to live.
Humanity’s overshoot
To track human demand on nature, scientists compare humanity’s ecological footprint with Earth’s biocapacity, the amount nature can regenerate each year. Humanity has used more than Earth renews since the early 1970s.
The Global Footprint Network marks the gap with Earth Overshoot Day. In 2026, it fell on 30 July. That means we use resources as if we had about 1.7 Earths. You can work out your own share, and compare 38 countries, in my Ecological Footprint Calculator.
Scientists also track nine planetary boundaries, the safe limits for Earth’s life-support systems. The 2025 Planetary Health Check found that seven of the nine have been crossed. They include climate change, biodiversity loss and, for the first time, ocean acidification.
The hopeful part: unlike reindeer, humans can see overshoot coming. Less food waste, cleaner energy and protecting wild places all reduce our environmental impact and lower our resource consumption.
Why carrying capacity matters for conservation
Wildlife managers use carrying capacity every day. It helps them decide how many animals a reserve can hold and how many fish can be caught sustainably. It also guides where to release threatened species. Before a reintroduction, ecologists check whether the habitat has enough food and shelter for a healthy population.
Habitat quality changes the number, too. I worked almost two years as a field ecologist around Sydney, controlling some of the most invasive plants. Weeds smother native plants, so removing them helps restore the food and shelter that native animals depend on.
Ecosystems are also interconnected. A change in one species’ carrying capacity ripples through the whole food web. Fewer insects mean less food for birds, and fewer birds mean less food for the predators above them. Explore these links in my Ecology Explorer and Ecosystem Lab. You can also meet the species that hold whole habitats together in my guide to keystone species.
Frequently asked questions
What is carrying capacity in simple words?
Carrying capacity is the largest number of one kind of animal or plant that a place can support long term. Beyond that number, there is not enough food, water or shelter for everyone.
What is the biological definition of carrying capacity?
In biology, carrying capacity (K) is the population size where a species’ birth rate equals its death rate. At K, the population growth rate is zero.
What are 5 examples of limiting factors?
Food availability, water, shelter or habitat space, predators and disease. For plants, sunlight and soil nutrients are also key limiting factors.
What happens when a population exceeds its carrying capacity?
It overshoots. Food and other resources run short, so deaths rise and births fall. Numbers then decline, sometimes in a crash. On St. Matthew Island, reindeer grew to about 6,000, then fell to 42 after the winter of 1963–64.
How many people can the Earth support?
Nobody knows exactly. In 1995, demographer Joel Cohen reviewed 66 published estimates of Earth’s human carrying capacity. They ranged from under 1 billion to more than 1 trillion people. Half fell between 4 and 16 billion. The answer depends on our diets, our technology and how we choose to live.
References
Cohen, J. E. (1995). Population growth and Earth’s human carrying capacity. Science, 269(5222), 341–346. https://doi.org/10.1126/science.7618100
Erisman, J. W., Sutton, M. A., Galloway, J., Klimont, Z., & Winiwarter, W. (2008). How a century of ammonia synthesis changed the world. Nature Geoscience, 1(10), 636–639. https://doi.org/10.1038/ngeo325
Gause, G. F. (1934). The struggle for existence. Williams & Wilkins.
Global Footprint Network. (2026). Earth Overshoot Day 2026. https://overshoot.footprintnetwork.org/
Jeffries, S., Huber, H., Calambokidis, J., & Laake, J. (2003). Trends and status of harbor seals in Washington State: 1978–1999. Journal of Wildlife Management, 67(1), 208–219. https://doi.org/10.2307/3803076
Klein, D. R. (1968). The introduction, increase, and crash of reindeer on St. Matthew Island. Journal of Wildlife Management, 32(2), 350–367. https://doi.org/10.2307/3798981
Miller, F. L., Barry, S. J., & Calvert, W. A. (2005). St. Matthew Island reindeer crash revisited: Their demise was not nigh—but then, why did they die? Rangifer, 25(4), 185–197. https://doi.org/10.7557/2.25.4.1783
Pearl, R., & Reed, L. J. (1920). On the rate of growth of the population of the United States since 1790 and its mathematical representation. Proceedings of the National Academy of Sciences, 6(6), 275–288. https://doi.org/10.1073/pnas.6.6.275
Richardson, K., Steffen, W., Lucht, W., Bendtsen, J., Cornell, S. E., Donges, J. F., et al. (2023). Earth beyond six of nine planetary boundaries. Science Advances, 9(37), eadh2458. https://doi.org/10.1126/sciadv.adh2458
United Nations, Department of Economic and Social Affairs, Population Division. (2024). World population prospects 2024: Summary of results. United Nations.