
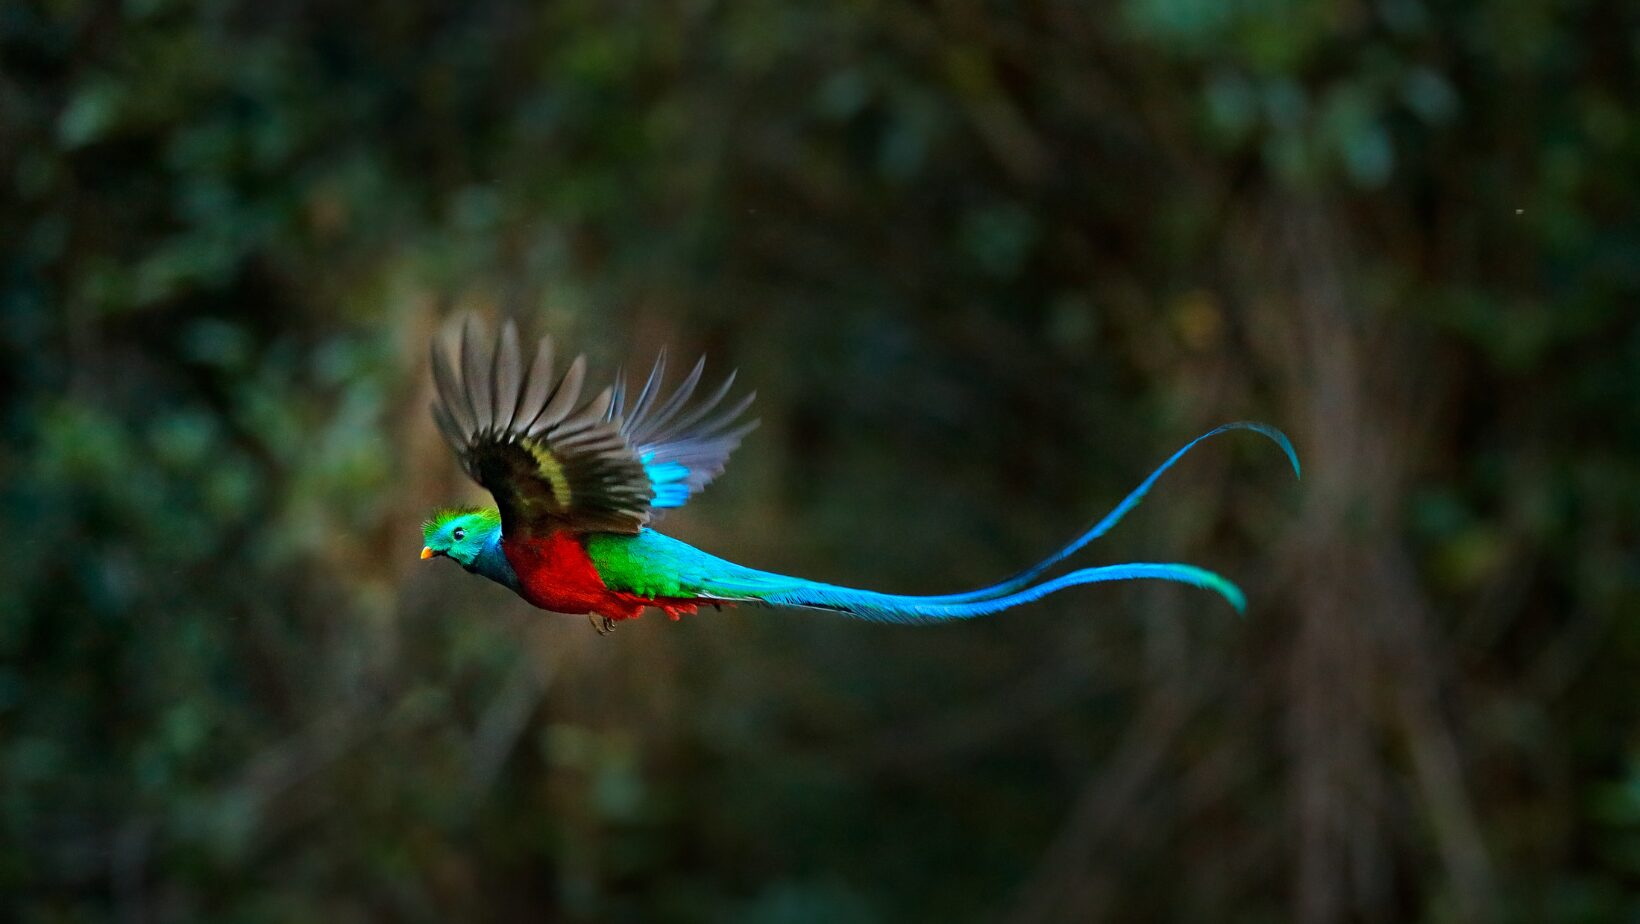
I have trekked the rainforests of Chiapas many times looking for a quetzal. At Palenque, I scanned the canopy for that famous green tail. I still have never seen one in the wild.
Naturally, that gap makes me ask a simple question. Are the forests these birds need actually protected? Not just on paper, but in the right places?
The Species Protection Report answers exactly that, every year. Released in October 2026, the 2026 Species Protection Report is the latest edition. Below, I break down its key findings, how the Species Protection Index works, and how scores changed since 2024.
🛡️ How well do you know species protection?
Twelve questions on the SPI, 30×30 and the biggest wins of 2026. Read on, then test yourself at the end.
Jump to the quiz ↓Species Protection Report 2026: Key Takeaways
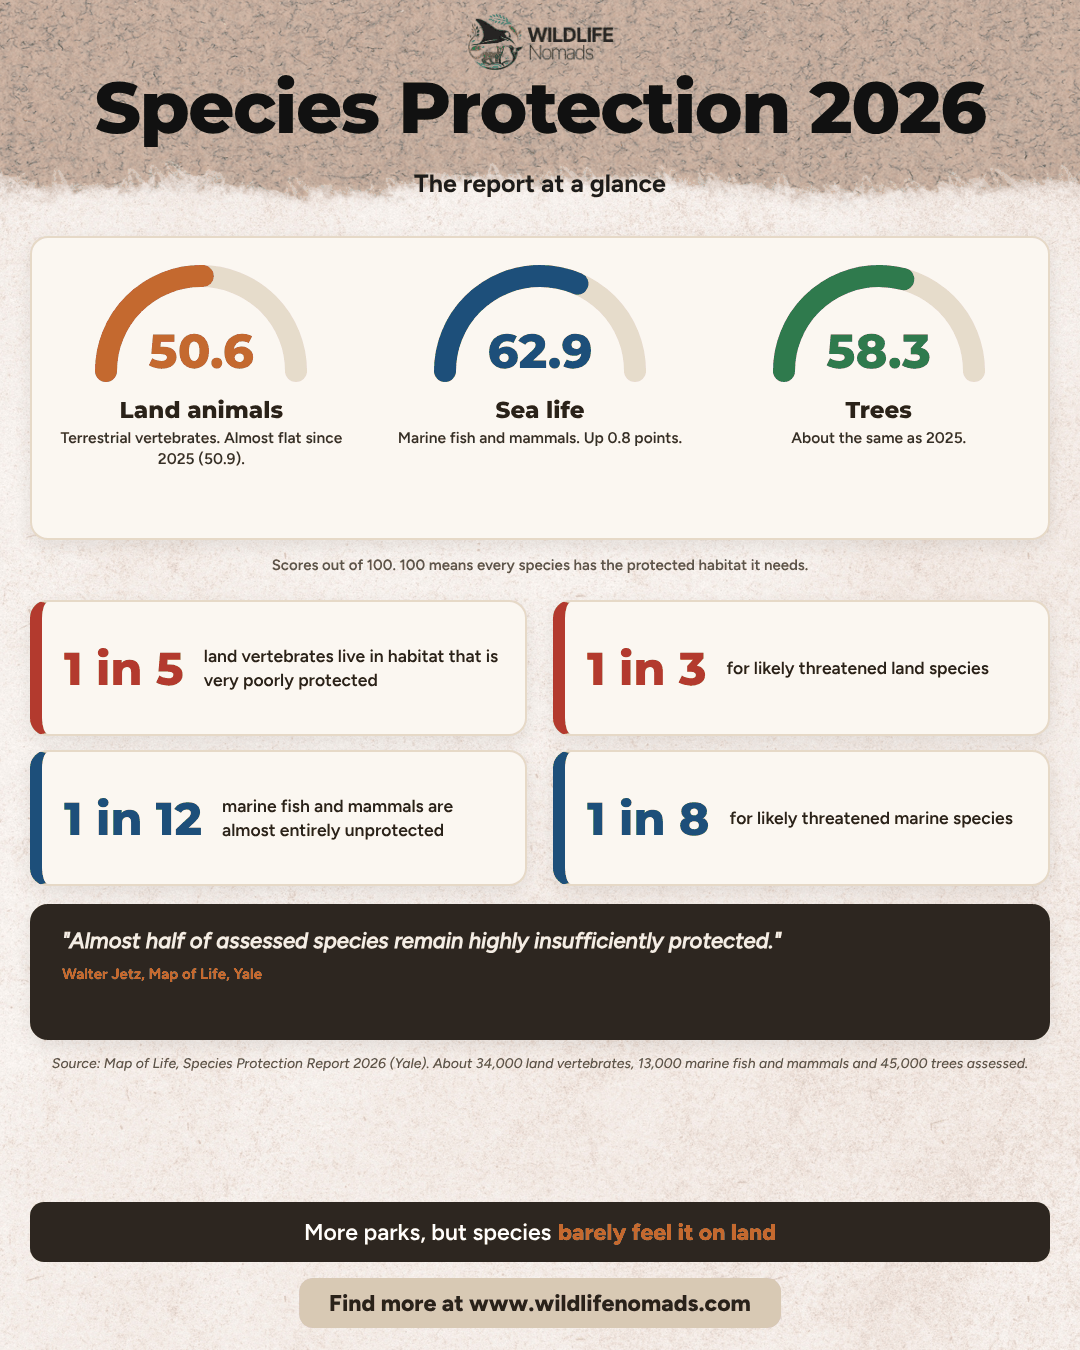
- Land: the global Species Protection Index for terrestrial vertebrates sits at 50.6 out of 100, almost unchanged since 2025.
- Sea: the marine index for fish and mammals rose 0.8 points to 62.9.
- Trees: the tree index stayed around 58.3.
- Coverage: by the report’s criteria, 15.1% of land and 9.8% of the ocean are protected.
- Gaps: 20% of land vertebrates and 8% of marine fish and mammals have protection scores below 10.
- At-risk species fare worse: for threatened, near-threatened and data-deficient species, those shares rise to 32% and 13%.
- Few new successes: only 24 land vertebrates and 44 marine species newly reached full protection.
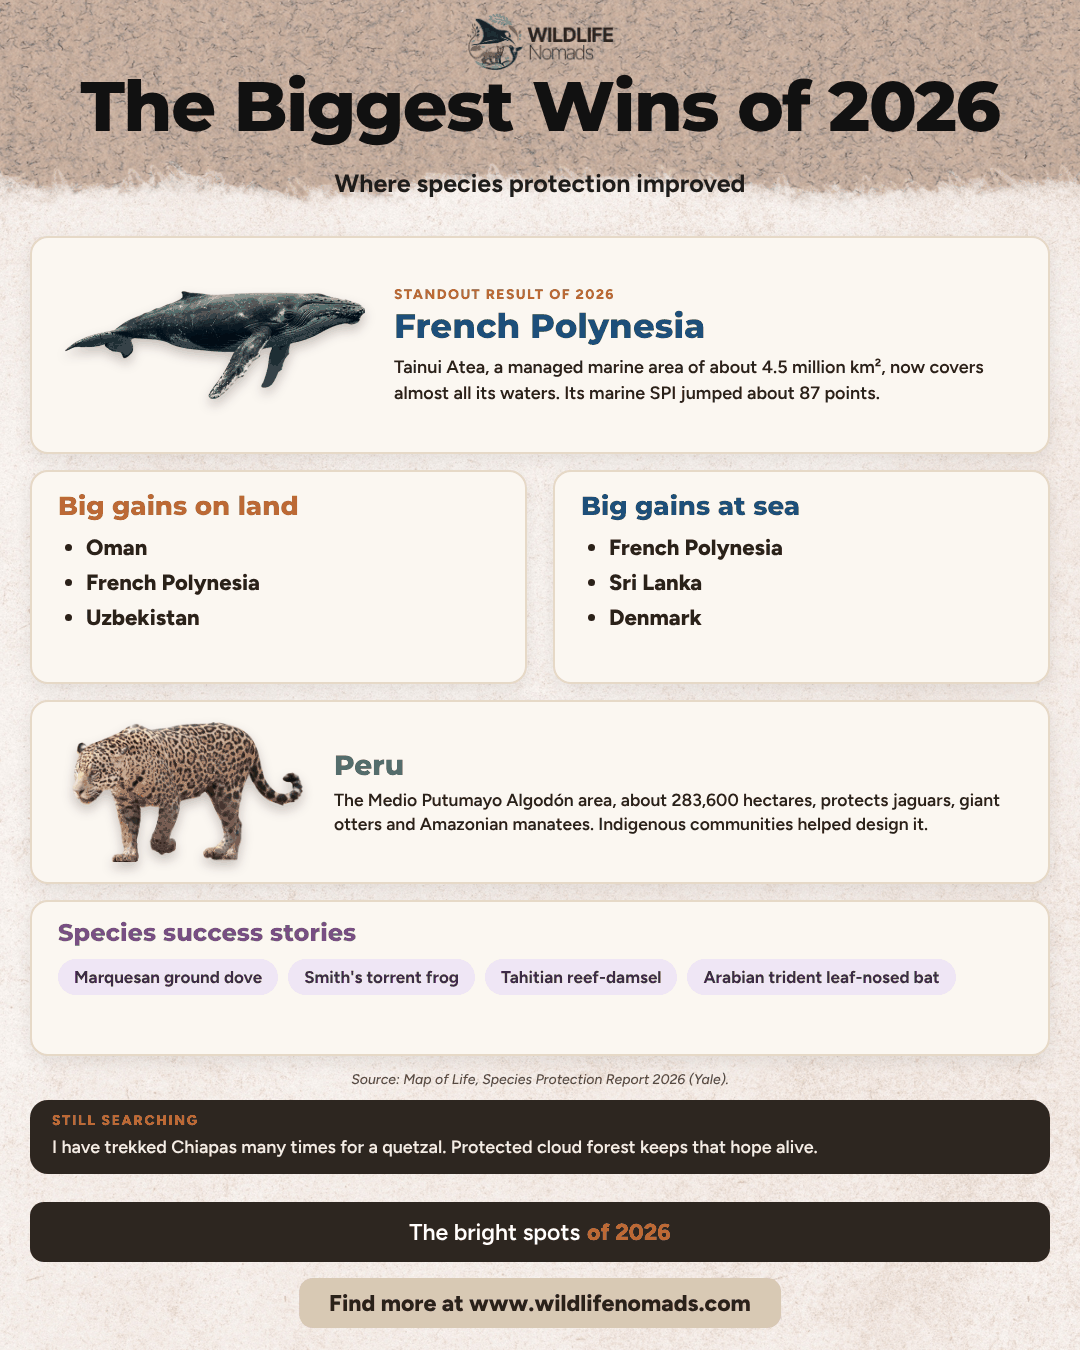
- Bright spots: Oman, French Polynesia and Uzbekistan on land; French Polynesia, Sri Lanka and Denmark at sea.
Walter Jetz, who leads the Map of Life team at Yale, summed it up for Yale News: “Almost half of assessed species remain highly insufficiently protected.” I agree. Protected area keeps growing, but species are barely feeling it on land.
What Is the Species Protection Report?
The report is an annual check-up on the protection of species worldwide. Map of Life, a Yale-led team, produces it under the GEO Biodiversity Observation Network, known as GEO BON.
It tracks progress on Target 3 of the Kunming-Montreal Global Biodiversity Framework. That target, known as 30×30, aims to protect 30% of land, inland waters and seas by 2030.
Each edition launches around the UN biodiversity summit. For example, the 2024 report appeared at COP16 in Cali, Colombia. Likewise, the 2026 edition was timed to COP17 in Yerevan, Armenia.
In total, the 2026 report covers about 34,000 land vertebrates, 13,000 marine fish and mammals, and 45,000 tree species. That makes it one of the largest species-level checks of protected areas anywhere.
We should preserve every scrap of biodiversity as priceless while we learn to use it and come to understand what it means to humanity.
E.O. Wilson
How the Species Protection Index Works
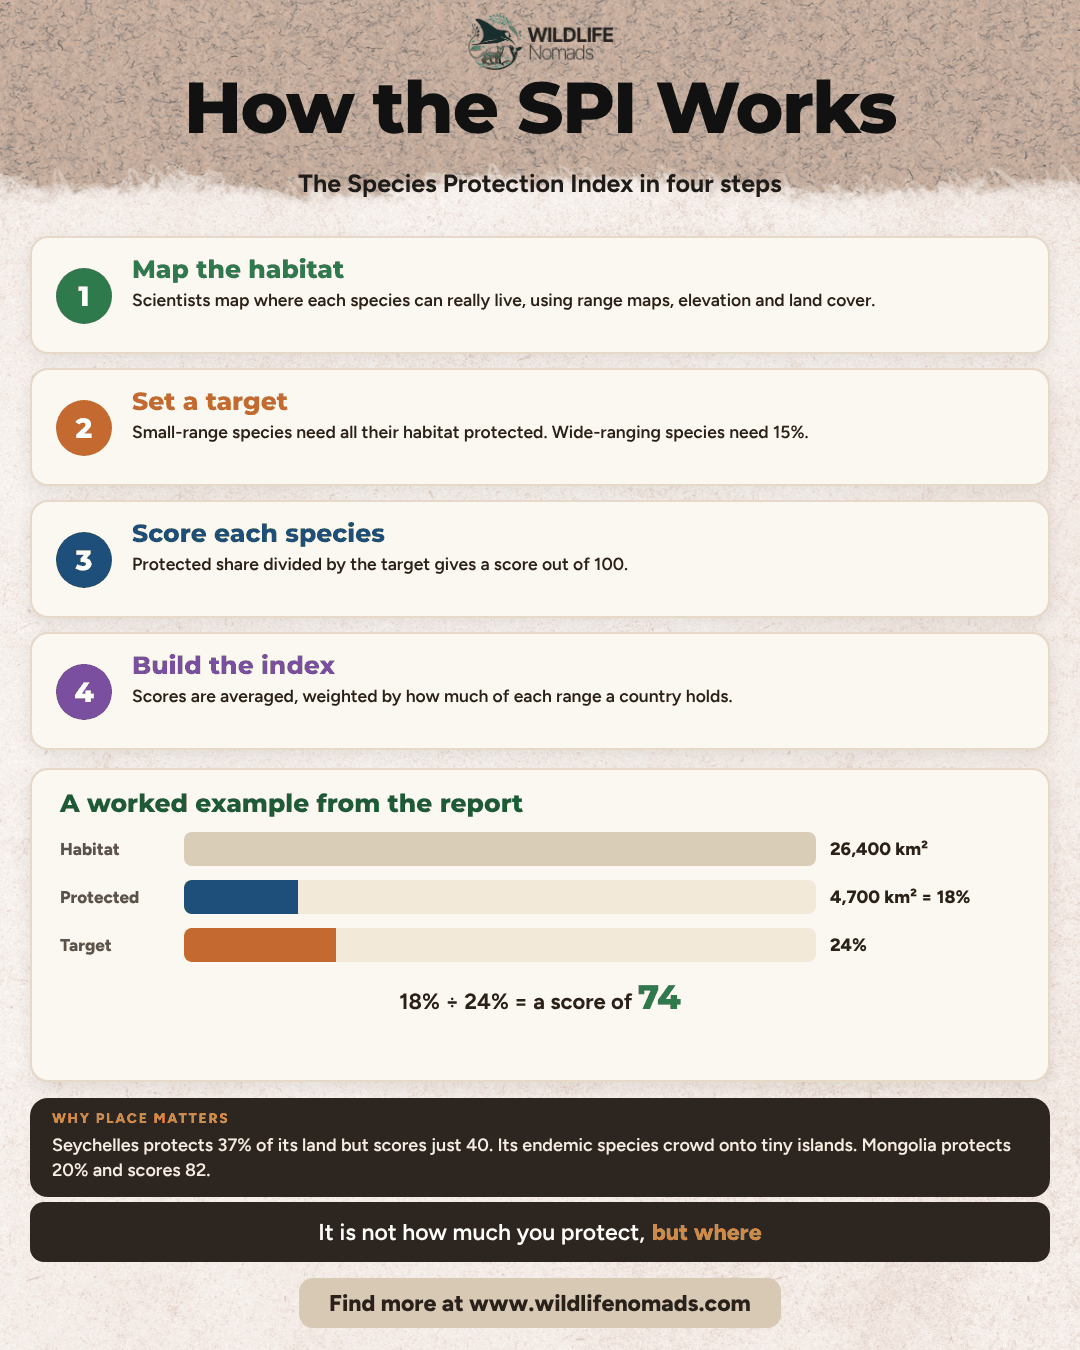
Step 1: Map Each Species’ Habitat
First, scientists map where each species can actually live. To do this, they combine expert range maps with habitat preferences, elevation, land cover and tree cover. The result is a habitat-suitable range, finer than a simple outline on a map.
Step 2: Give Each Species a Protection Score
Next, each species gets a protection target, based on range size. In general, rare, small-range species need more of their habitat protected. For instance, species with ranges under 10,000 km² have a 100% target, while wide-ranging species need 15%.
In the report’s own worked example, the numbers look like this. A species has 26,400 km² of habitat, and 4,700 km² is protected. That is 18% of its habitat against a 24% target, so its Species Protection Score is 74.
Step 3: Combine Scores Into the Index
Finally, the scores are averaged into a national, regional or global SPI. Also, each species is weighted by how much of its range a country holds. That country is its main steward.
In other words, a score of 50 means species are, on average, halfway to the protection they need. A score of 100 means every species meets its target.
Why the SPI Rewards the Right Places
Importantly, the index doesn’t reward area alone. A huge park in a species-poor desert barely moves the score. However, a small reserve protecting rare endemics can move it a lot.
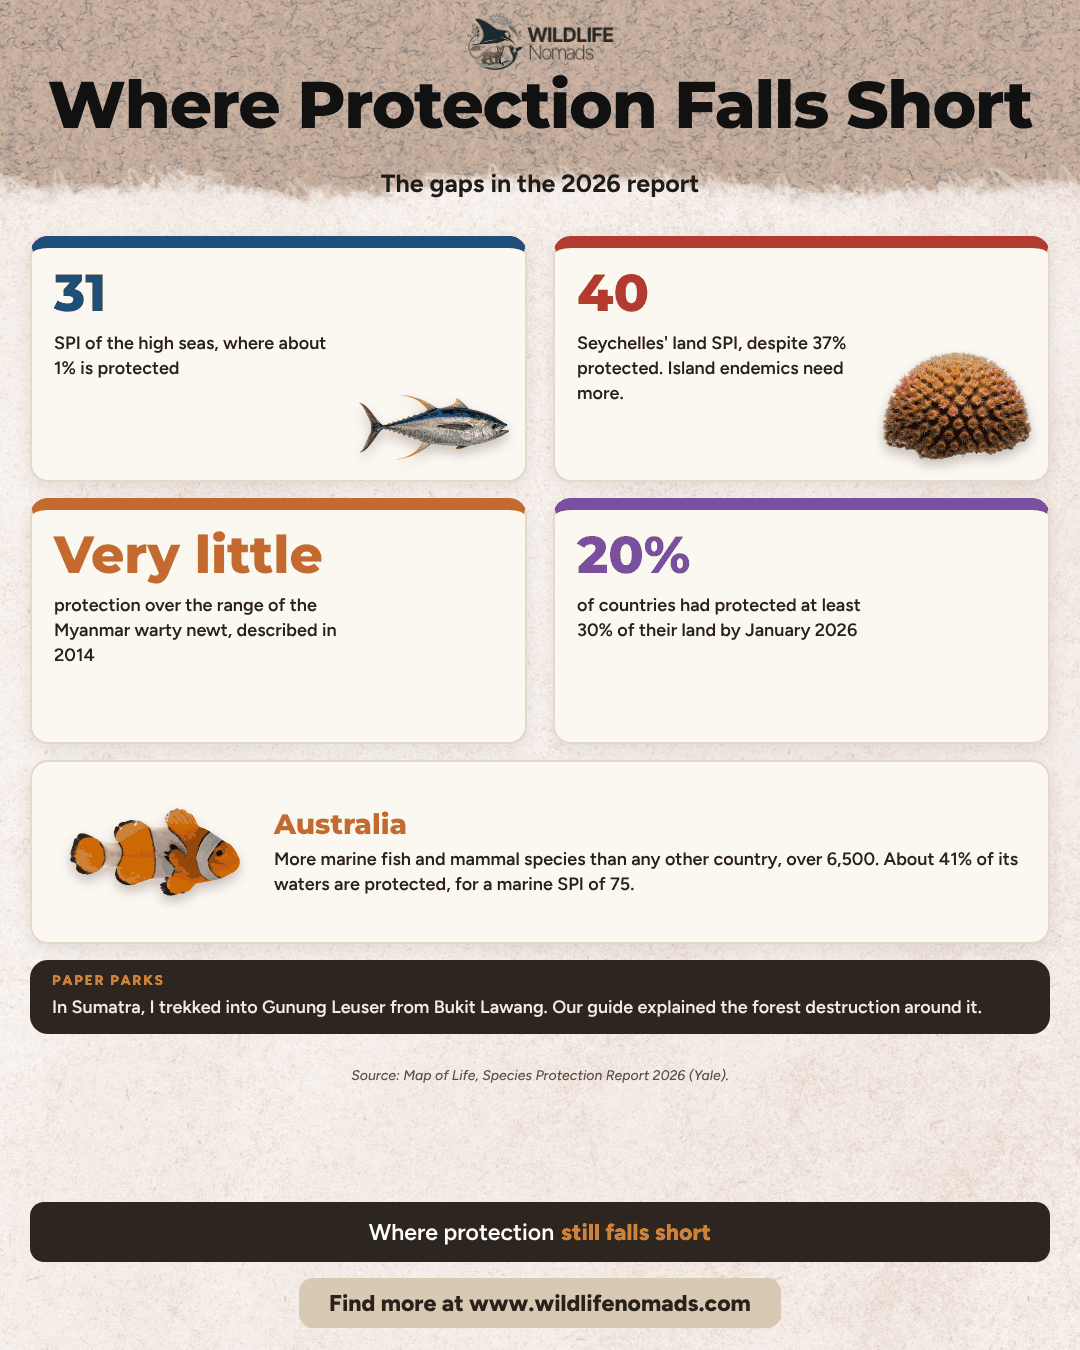
The 2026 report shows this clearly, for instance. Seychelles protects 37% of its land but scores just 40, because its many endemic species squeeze into tiny islands. Mongolia protects 20% and scores 82.
Species Protection Index Over Time: 2024 vs 2025 vs 2026
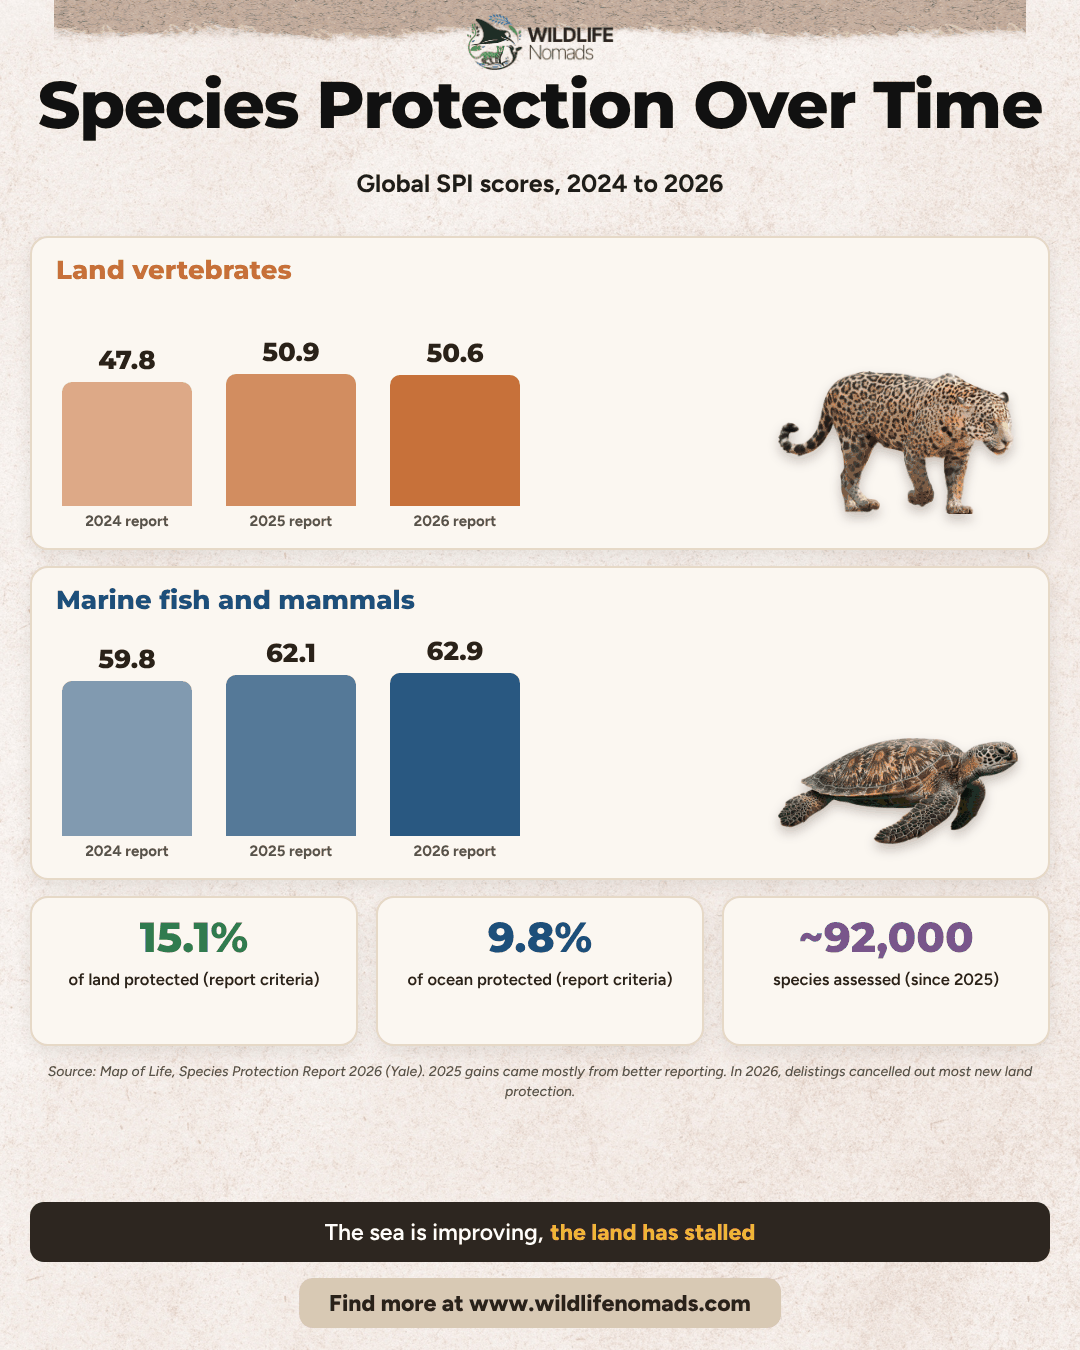
| Indicator | 2024 report | 2025 report | 2026 report |
|---|---|---|---|
| Land vertebrate SPI | 47.8 | 50.9 | 50.6 |
| Marine fish and mammal SPI | 59.8 | 62.1 | 62.9 |
| Tree SPI | Not assessed | 58.3 | ~58.3 |
| Land protected (report criteria) | 14.4% | 15.1% | 15.1% |
| Ocean protected (report criteria) | 6.7% | 8.4% | 9.8% |
| Species assessed | ~46,000 | ~92,000 | ~92,000 |
So what happened? In 2025, better reporting of existing reserves and new protected areas lifted scores on land and sea. In contrast, 2026 brought delistings that cancelled out most new land protection.
Meanwhile, the oceans kept improving. Over 5 million km² of ocean joined the protected network in 2026, mostly in French Polynesia and the North Atlantic.
Finally, a quick note on coverage numbers. The Protected Planet Report 2024 put coverage at 17.6% of land and 8.4% of the ocean. However, the SPI team filters the same database differently, so its figures run lower.
The Biggest Wins of 2026
French Polynesia: A Whole Ocean Protected
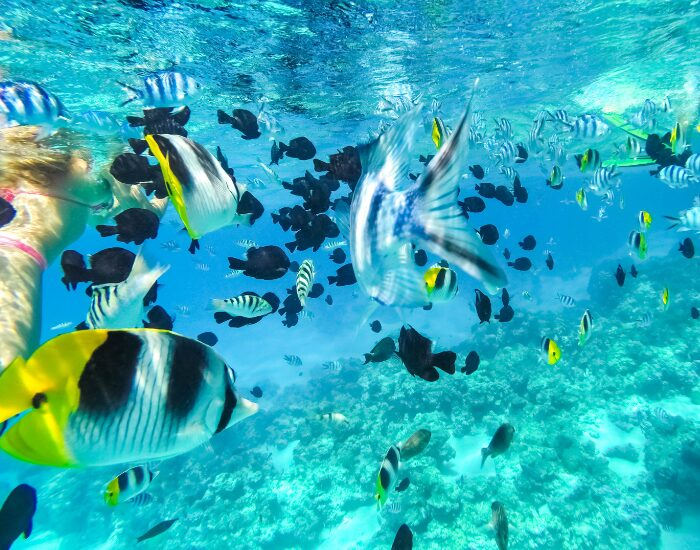
French Polynesia delivered the year’s standout result. In September 2025, it strengthened Tainui Atea, a managed marine area covering about 4.55 million km².
In addition, the new rules banned mineral mining and created zones for artisanal fishing only. They also added a strict nature reserve where fishing is banned. As a result, the territory’s marine SPI jumped about 87 points.
Its waters hold over 2,000 marine fish and mammal species. Learn more about marine protected areas and how they work.
Peru: Protection Built With Communities
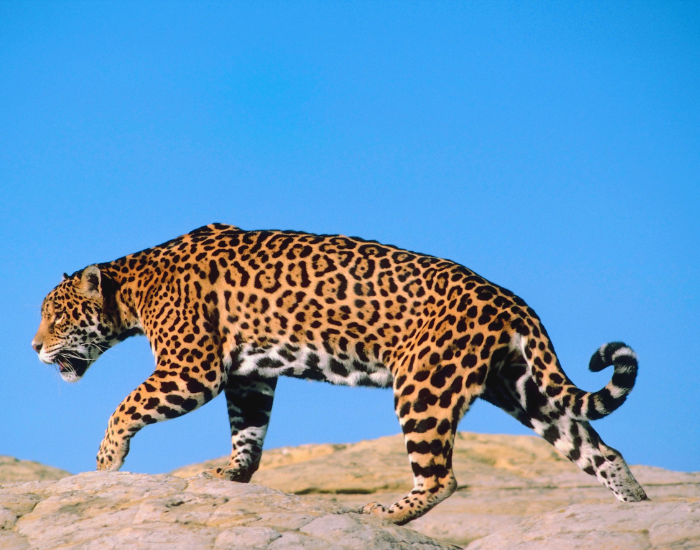
Peru shows how local partnerships work. In June 2025, it created the Medio Putumayo Algodón Regional Conservation Area, covering about 283,600 hectares in Loreto.
Today, the area protects jaguars, giant river otters and Amazonian manatees. Indigenous communities helped design it. Peru now has a tree SPI of 75 with just 22% of its land protected.
Benin and the Species Success Stories
Meanwhile, Benin gained 12 points after reporting two Ramsar wetland sites to the global database. These coastal wetlands now cover over 11,000 km².
Individual species benefited too. For example, Smith’s torrent frog is a vulnerable stream frog in Guinea. It gained from the expanded Rio Kapatchez Ramsar site, now nearly 7,000 km². The Tahiti butterflyfish jumped 52 points to a score of 75.
Where Species Protection Still Falls Short
The gaps remain huge. One in five land vertebrates has a protection score below 10. For threatened, near-threatened and data-deficient species, it’s one in three.
Worse still, some species have almost nothing. The Myanmar warty newt, described only in 2014, has very little protection over its range. Deforestation for farming and the pet trade threaten it.
The high seas lag, too. International waters have an SPI of just 31, with about 1% protected. Islands also struggle, because many endemic species crowd into small areas. See our Endangered Animals Explorer for species at risk.
What the Report Means for Australia
Australia’s waters hold more marine fish and mammal species than any other country’s, over 6,500. About 41% of its waters are protected, giving a marine SPI of 75.
Much of that comes from the Coral Sea Marine Park, at nearly 1 million km². Personally, I first saw the Great Barrier Reef in 2019. It was my first wild clownfish, and my first coral bleaching.
On my lap around Australia, I’ve camped in national parks from Booti Booti to Woody Head. Read our guide to the best NSW national parks.
What Is Species-Level Conservation?
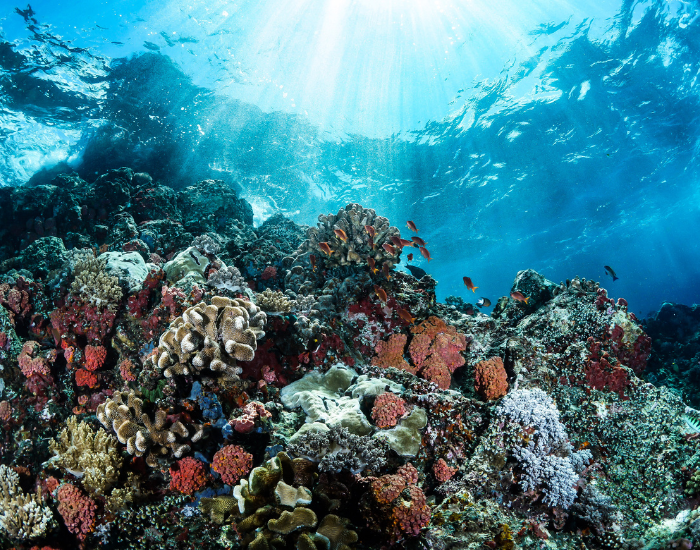
Species-level conservation focuses on the survival of individual species. To do so, it uses habitat protection, captive breeding and legal protection tailored to each species’ needs.
The SPI connects this approach with area-based targets. It shows exactly which species a new reserve helps, and which it misses. That matters for three reasons:
- Preventing extinctions: the index points funding at the species with the biggest gaps.
- Tracking ecosystem health: many species act as early warnings for wider damage.
- Keeping genetic diversity: protecting unique species keeps options open for adaptation.
Learn more in our guides on how to save endangered animals and why biodiversity is important.
SPI vs the Species Habitat Index (SHI)
The Species Habitat Index is the SPI’s sister metric, also from Map of Life. It tracks whether species’ suitable habitat is growing or shrinking over time.
Together, they tell a fuller story. The SPI asks whether habitat is protected. The SHI asks whether that habitat still exists.
If the SHI keeps falling while the SPI rises, reserves may sit in the wrong places. Read more on habitat destruction.
Protected Areas Alone Won’t Save Species
Still, lines on a map are only the start. In fact, studies show many protected areas lack funding, staff or enforcement. The Protected Planet Report 2024 found that under 5% of land is covered by effectiveness assessments.
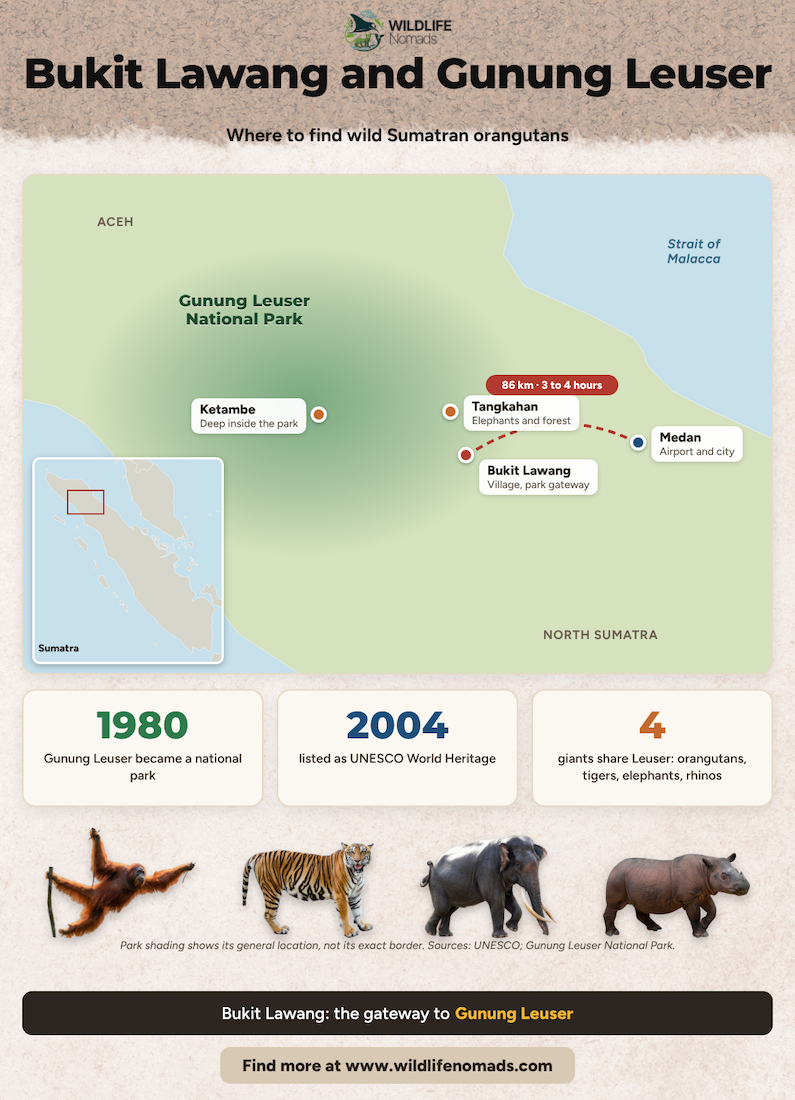
In Sumatra, I trekked into Gunung Leuser National Park from Bukit Lawang. Our guide explained the forest destruction around it. A park needs real protection on the ground.
Connections matter, too. In Banff, Canada, I saw the wildlife overpasses that let animals cross the highway between habitats. Read about wildlife corridors and whether protected areas are effective.
Indigenous territories and other conserved areas, called OECMs, count toward 30×30 too. Research suggests many protect biodiversity as well as formal parks.

Achieving 30×30 Through Meaningful Protection
The world is still far from 30×30. As of January 2026, only 20% of countries had protected at least 30% of their land. At sea, 52 exclusive economic zones have reached it.
Yet the SPI shows that placement matters more than percentages. Most countries score higher than their protected percentage, which means reserves often sit in valuable habitat.
Therefore, the next step is targeting. New reserves should cover the species with the lowest scores. Learn how rewilding can help restore the gaps.
FAQs About the Species Protection Report
It is an annual report by Map of Life that measures how well protected areas cover the habitats species need. It tracks progress on Target 3, the 30×30 goal of the Kunming-Montreal Global Biodiversity Framework. The 2026 edition was released in October 2026.
The SPI scores how well protected areas cover species’ habitats, from 0 to 100. It averages individual Species Protection Scores, weighted by each country’s share of each species’ range. A score of 50 means species are halfway to adequate protection.
The global SPI for land vertebrates was 50.6 out of 100, almost unchanged from 2025. The marine SPI for fish and mammals rose to 62.9. The tree SPI stayed around 58.3.
Species-level conservation focuses on the survival of individual species. It uses tailored actions such as habitat protection, breeding programs and legal protection. The SPI supports it by showing which species each protected area helps.
The SPI measures how much of a species’ habitat is protected. The Species Habitat Index measures whether that habitat is growing or shrinking over time. Used together, they show whether reserves sit in the right places.
GEO BON, the Group on Earth Observations Biodiversity Observation Network, supports global biodiversity monitoring. Map of Life developed the SPI under GEO BON, and it is a formally adopted indicator for 30×30.
Oman, French Polynesia and Uzbekistan improved most on land. At sea, French Polynesia, Sri Lanka and Denmark led. French Polynesia’s marine SPI jumped about 87 points.
Check Your Country’s Score
You can explore the SPI for any country on the Map of Life SPI page. We’ll update this post each October when the new report lands.
Meanwhile, support local reserves, report sightings to citizen-science apps and back policies that protect the right places. As a conservation biologist, I’ve seen restoration work up close, including my own research on koala habitat.
I still hope to see a wild quetzal one day. Protecting its cloud forests is how that stays possible. Which species in your country needs better protection? Tell me in the comments.
References:
Butchart, S. H. M., Clarke, M., Smith, R. J., Sykes, R. E., Scharlemann, J. P. W., Harfoot, M., Buchanan, G. M., Angulo, A., Balmford, A., Bertzky, B., Brooks, T. M., Carpenter, K. E., Comeros-Raynal, M. T., Cornell, J., Ficetola, G. F., Fishpool, L. D. C., Fuller, R. A., Geldmann, J., Harwell, H., . . . Burgess, N. D. (2015). Shortfalls and solutions for meeting national and global conservation area targets. Conservation Letters, 8(5), 329–337. https://doi.org/10.1111/conl.12158
Hanson, J. O., Rhodes, J. R., Butchart, S. H. M., Buchanan, G. M., Rondinini, C., Ficetola, G. F., & Fuller, R. A. (2020). Global conservation of species’ niches. Nature, 580(7802), 232–234. https://doi.org/10.1038/s41586-020-2138-7
Jetz, W., McGowan, J., Rinnan, D. S., Possingham, H. P., Visconti, P., O’Donnell, B., & Londoño-Murcia, M. C. (2022). Include biodiversity representation indicators in area-based conservation targets. Nature Ecology & Evolution, 6(2), 123–126. https://doi.org/10.1038/s41559-021-01620-y
Maxwell, S. L., Cazalis, V., Dudley, N., Hoffmann, M., Rodrigues, A. S. L., Stolton, S., Visconti, P., Woodley, S., Kingston, N., Lewis, E., Maron, M., Strassburg, B. B. N., Wenger, A., Jonas, H. D., Venter, O., & Watson, J. E. M. (2020). Area-based conservation in the twenty-first century. Nature, 586(7828), 217–227. https://doi.org/10.1038/s41586-020-2773-z
Powers, R. P., & Jetz, W. (2019). Global habitat loss and extinction risk of terrestrial vertebrates under future land-use-change scenarios. Nature Climate Change, 9(4), 323–329. https://doi.org/10.1038/s41558-019-0406-z
Venter, O., Fuller, R. A., Segan, D. B., Carwardine, J., Brooks, T., Butchart, S. H. M., Di Marco, M., Iwamura, T., Joseph, L., O’Grady, D., Possingham, H. P., Rondinini, C., Smith, R. J., Venter, M., & Watson, J. E. M. (2014). Targeting global protected area expansion for imperiled biodiversity. PLoS Biology, 12(6), e1001891. https://doi.org/10.1371/journal.pbio.1001891
Watson, J. E. M., Dudley, N., Segan, D. B., & Hockings, M. (2014). The performance and potential of protected areas. Nature, 515(7525), 67–73. https://doi.org/10.1038/nature13947
Report data: Map of Life (2026). The 2026 Species Protection Report. Yale Center for Biodiversity and Global Change. Earlier editions: Map of Life and the E.O. Wilson Biodiversity Foundation (2024, 2025).