Wildlife Interactives

Maps, games and tools built from field data.
Free, no sign-up, and they work on a phone.
These are the Wildlife Interactives: maps, tools and games about how animals move and how big they are. Each one is built from published data rather than artistic licence. Everything is free, needs no sign-up, and works on a phone.
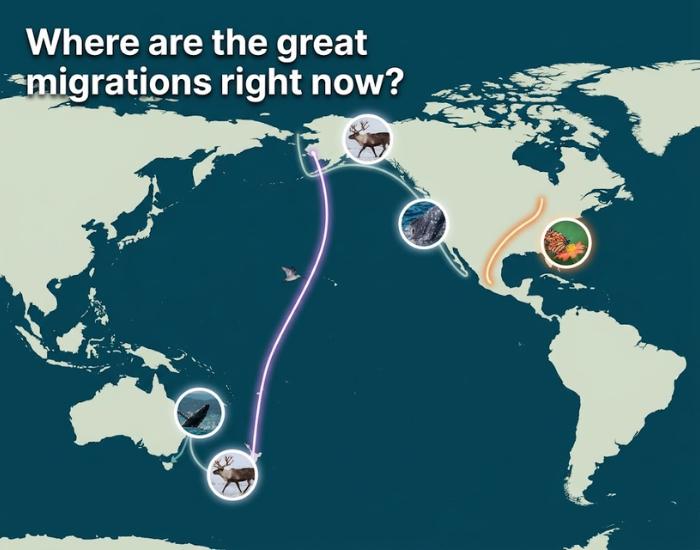 6 maps live · more coming
Migration Maps
Where the world’s great herds are, month by month. Follow them around the loop and see what happens where. Browse the maps →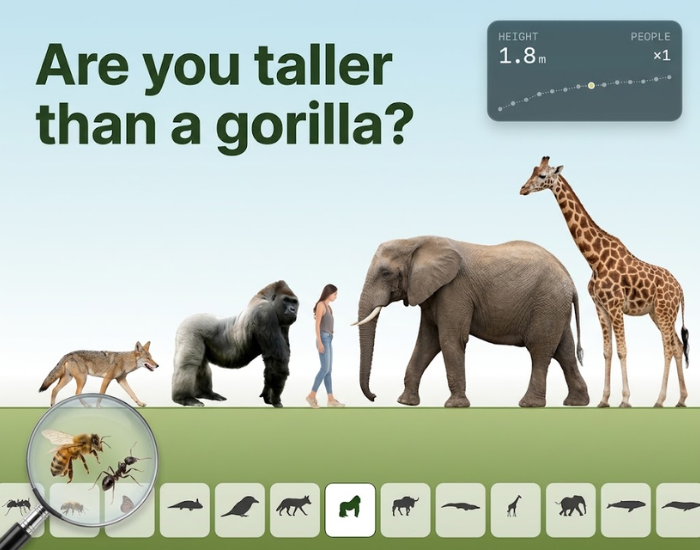 14 animals · head to head · game
Animal Size Comparison
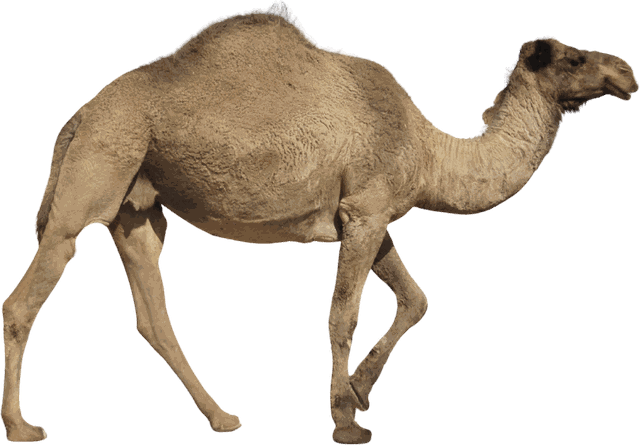
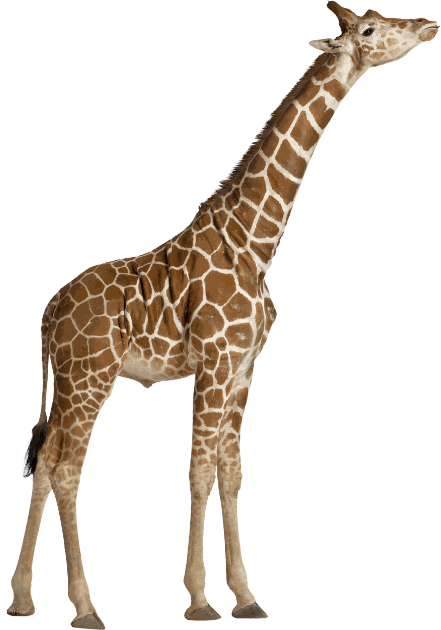
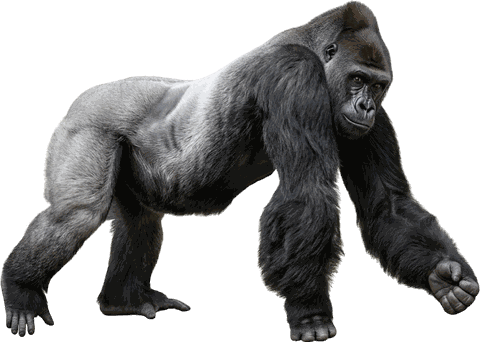
Fourteen animals at one true scale, from a half-millimetre tardigrade to a thirty-metre blue whale, with a person beside each one. Then guess their sizes in the game. Open the comparison →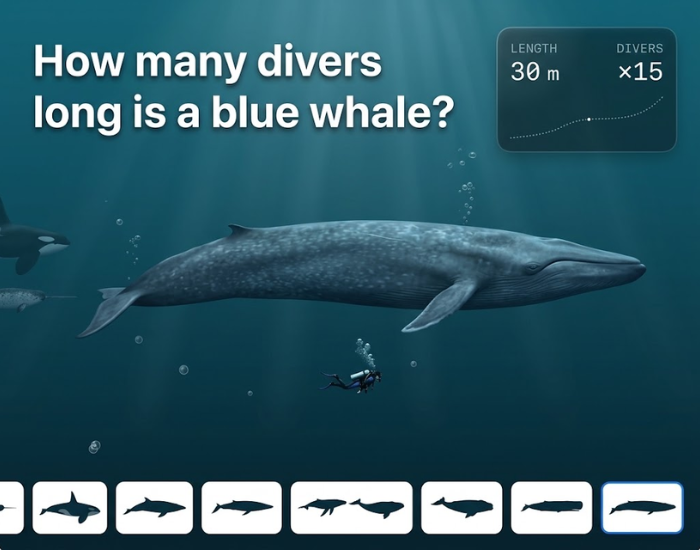 14 whales · depth gauge · game
Whale Size Comparison
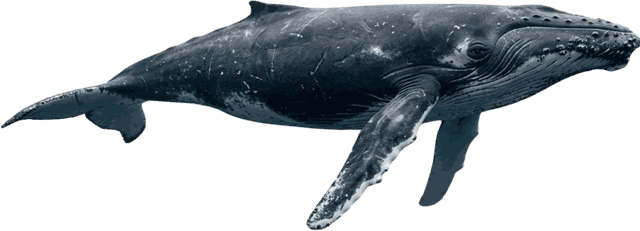
Fourteen whales at one true scale, from a four-metre beluga up to a blue whale, with a diver alongside every one and a gauge showing how deep each one dives. Open the comparison →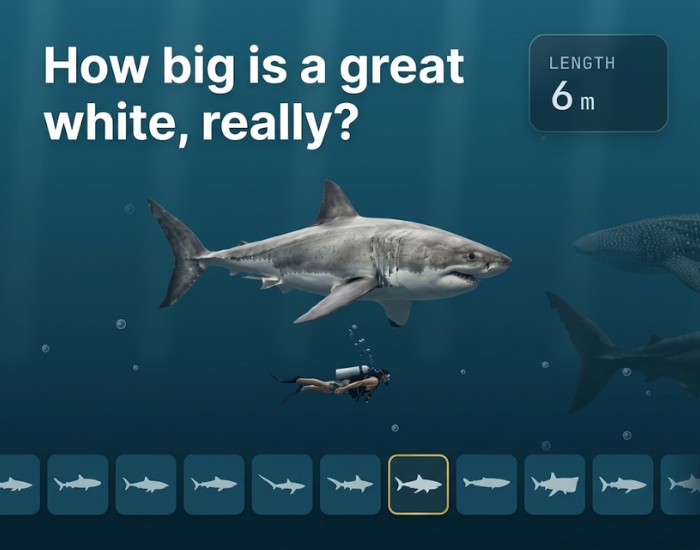 20 sharks · game
Shark Size Comparison
Twenty sharks at one true scale, from a 27 cm pygmy shark to a 15 m megalodon. Pit any two head to head, then test your eye in the guessing game. Open the comparison →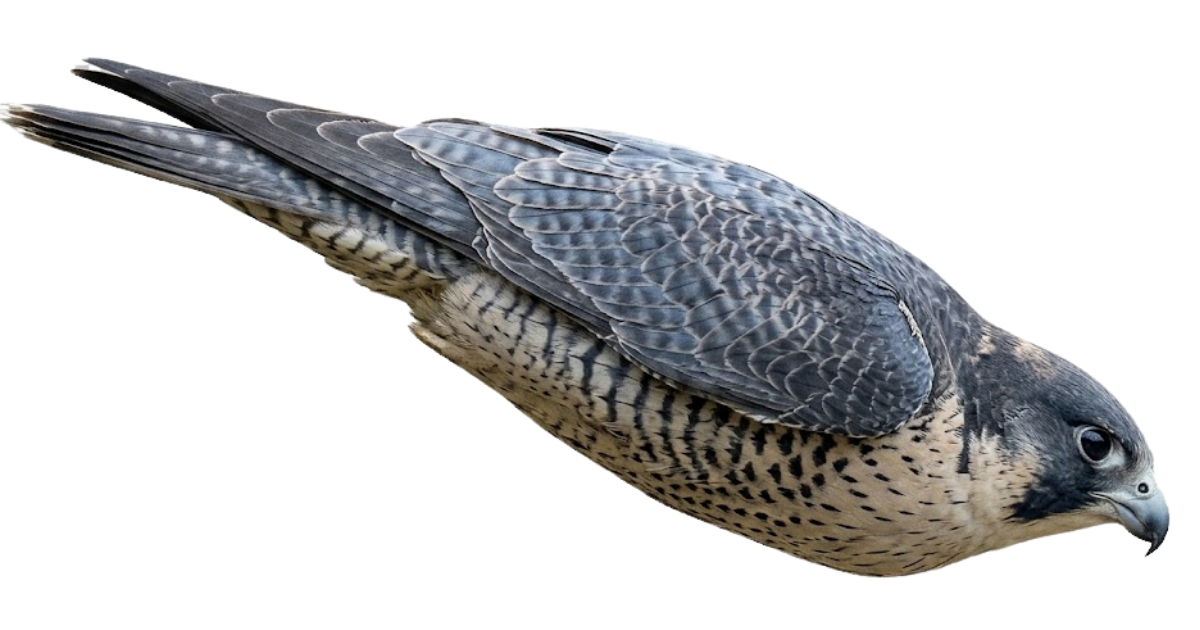
 44 racers · game
The Great Animal Speed Race
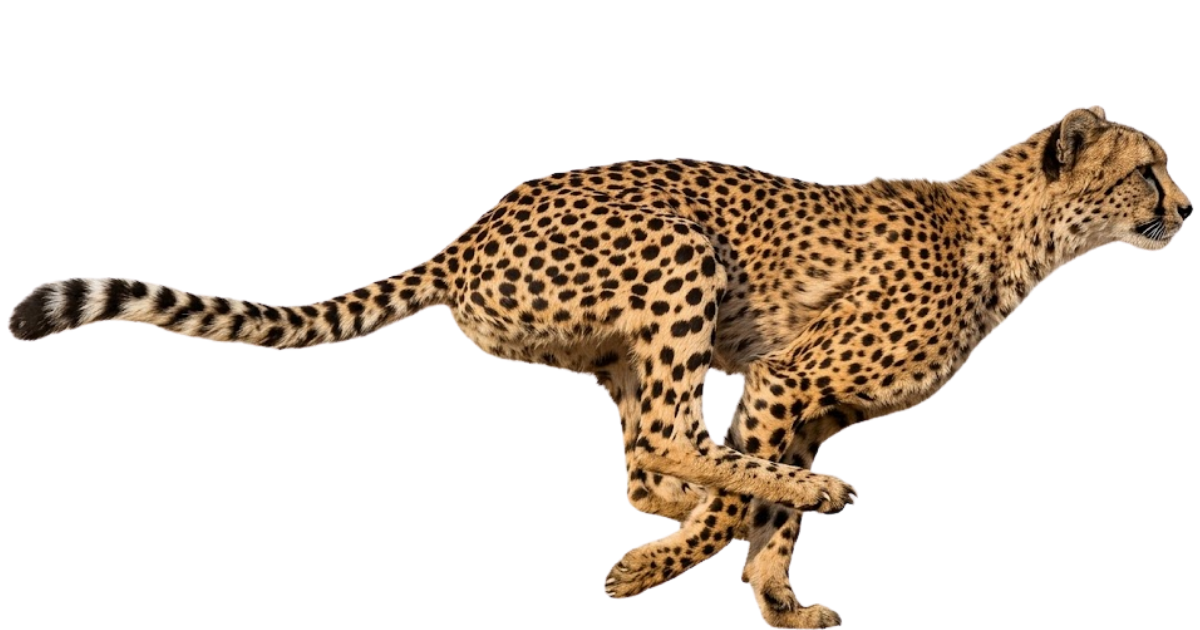
Race the fastest animals on land, in the air and in the water against Usain Bolt. Predict the winner, spin the speed dial, and find out which famous records are myths. Start the race →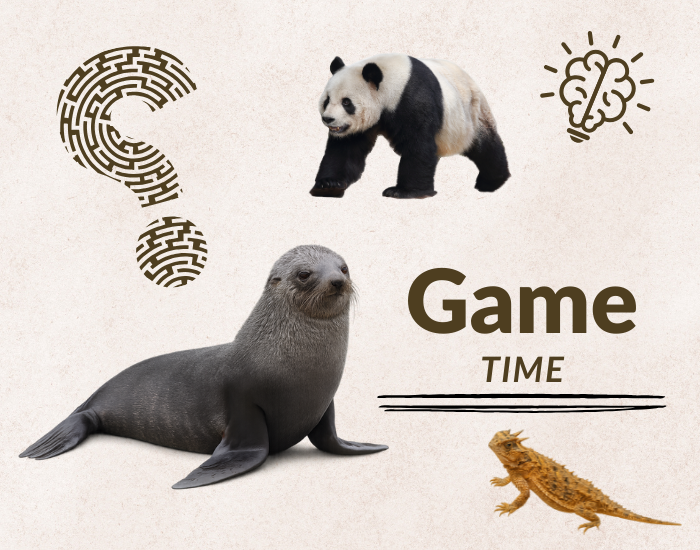 5 games live
Games & Quizzes
Memory matches, picture rounds, trivia and personality quizzes. Easy enough for kids, harder than they look. Play something →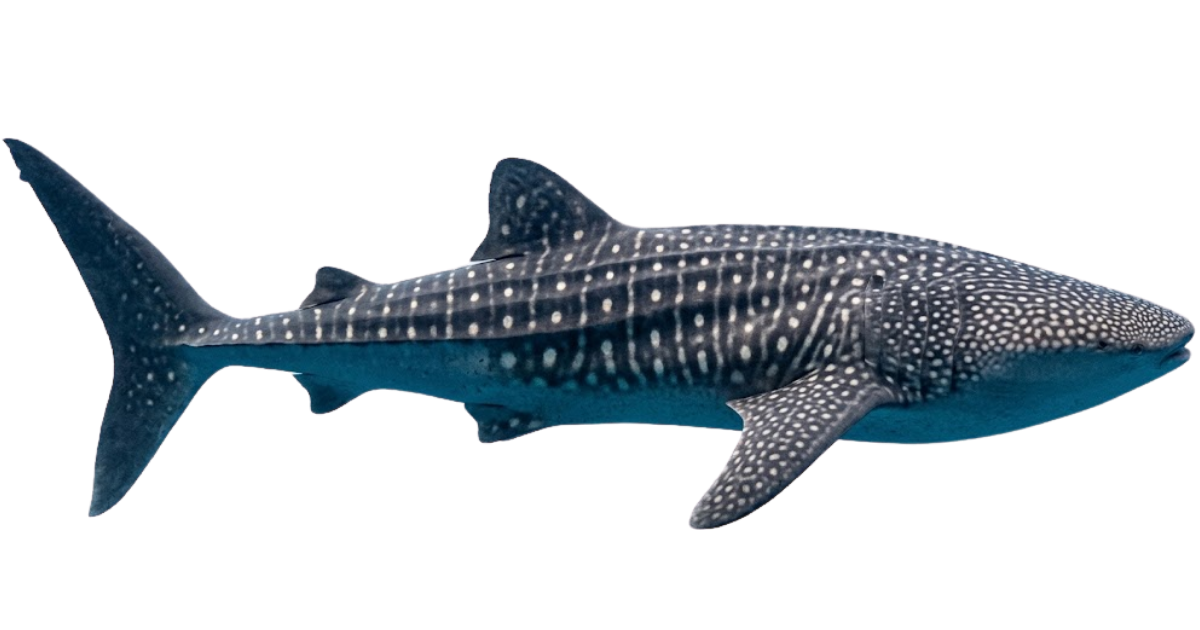

 0 m1,000 m10,935 m
61 species · deep dive
Deep Sea Dive
Scroll 10,935 m from the waves to the bottom of the Mariana Trench. Shine your torch, ping your sonar and log every deep sea species on the way. Start the dive → 1 day10 yrs1001,000∞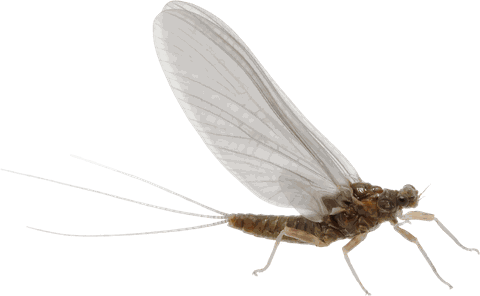

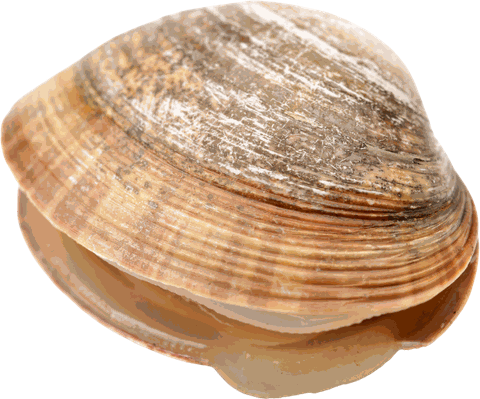
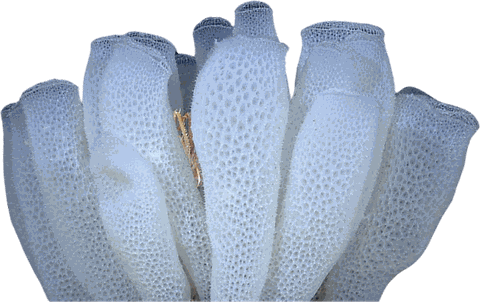
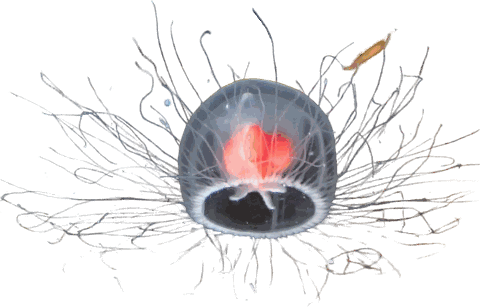 50 animalsMinutes to 11,000 years
New · 50 animals · 3 modes
How Long Do Animals Live?
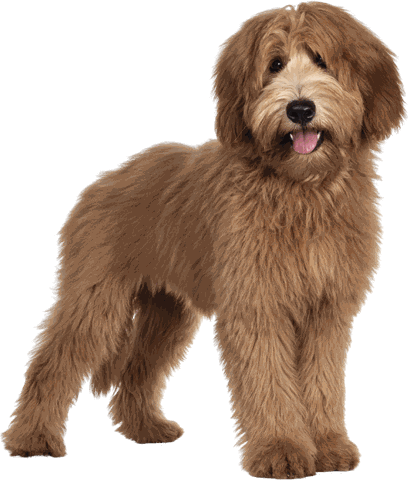
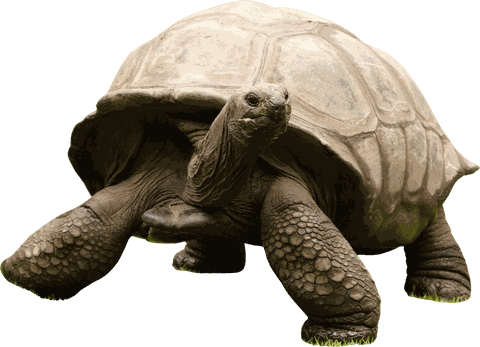
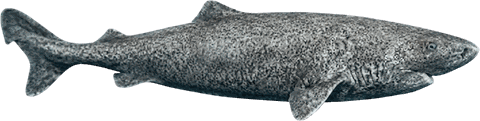
Travel through time from a 5-minute mayfly to an 11,000-year-old glass sponge. See which animals you have already outlived, then play Which lives longer? Start time travel →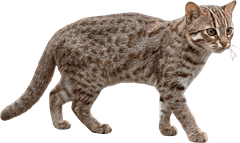
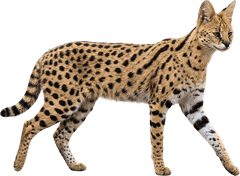
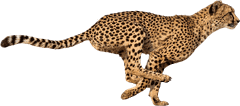
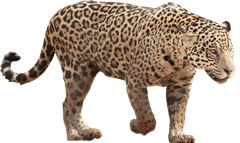
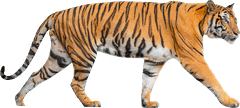
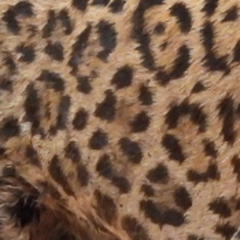 32 catsTrue to scale
New · 32 cats · 4 modes
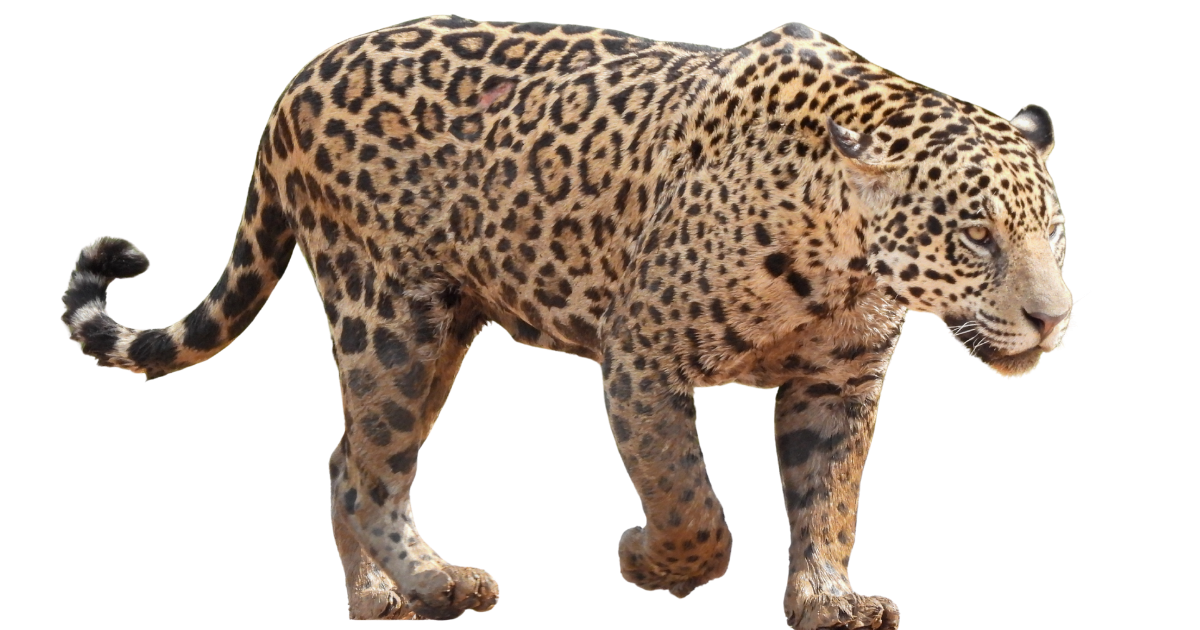
Wild Cat Explorer
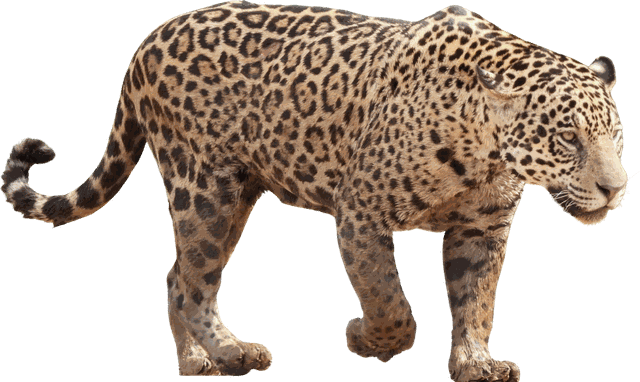
Jaguar or leopard? Put any two wild cats side by side, true to scale, read their coats, then play Spot the cat. Compare wild cats →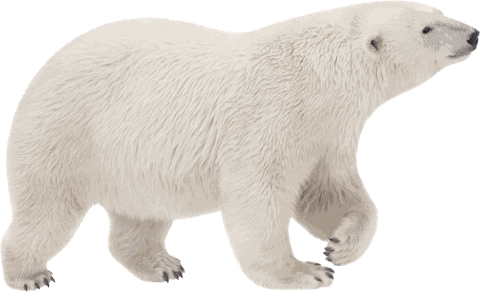
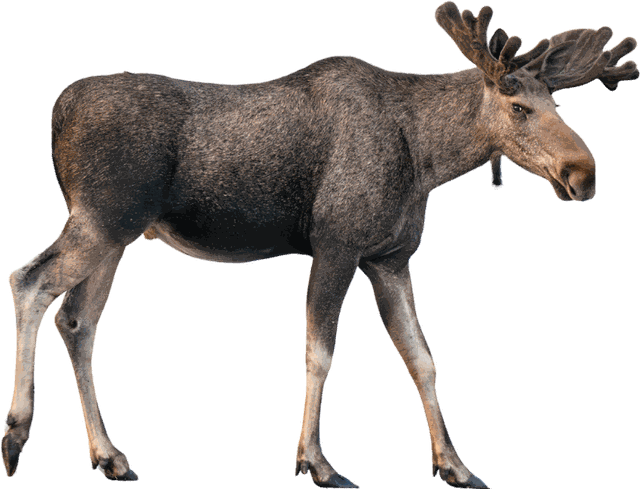
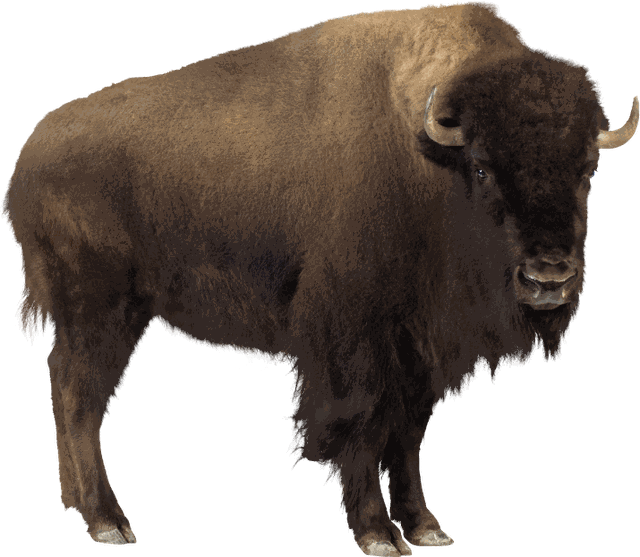
 9 biomes61 animals
9 biomes · 61 animals
Biome Explorer
Travel from the Arctic tundra to the ocean through the nine types of biomes. Meet the animals, build a biome from the climate, then take the quiz. Start the journey →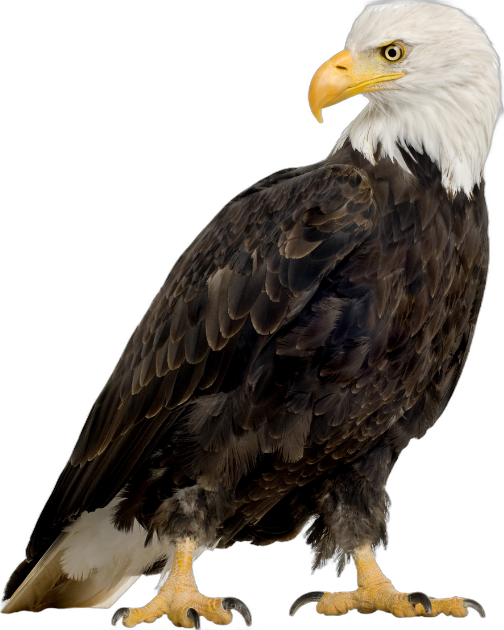
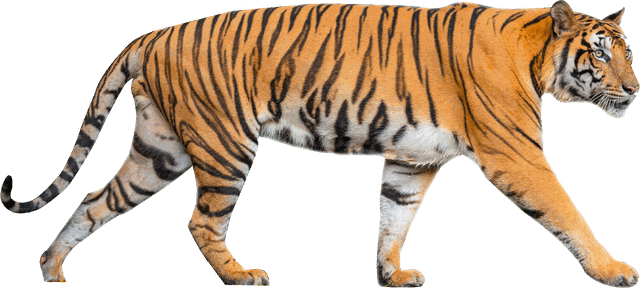
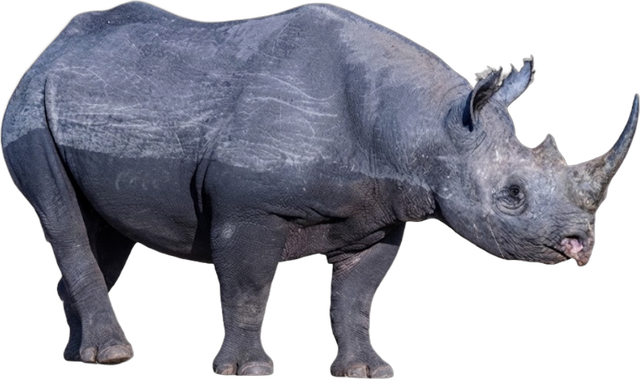
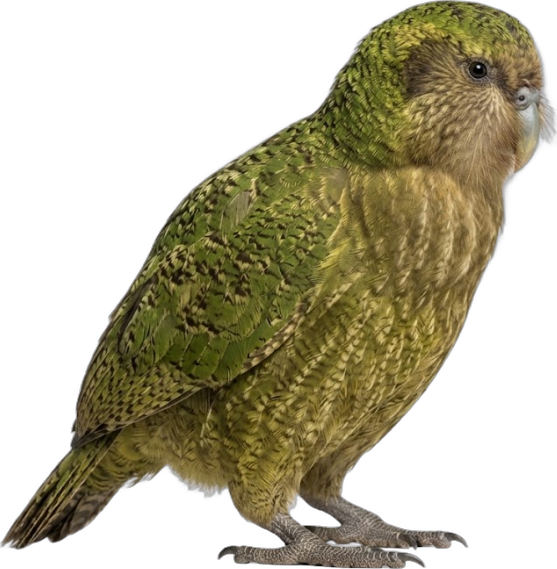
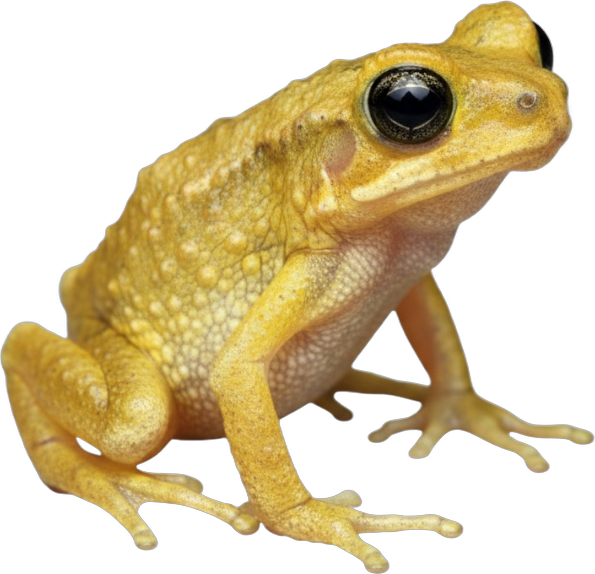
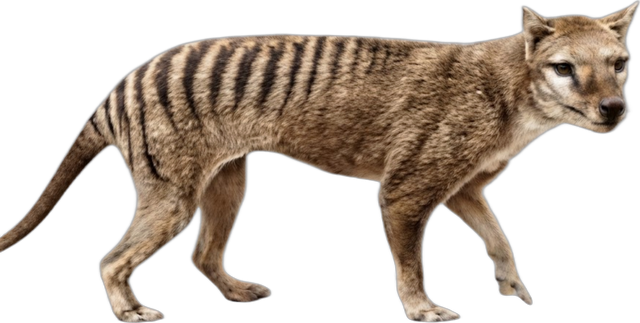
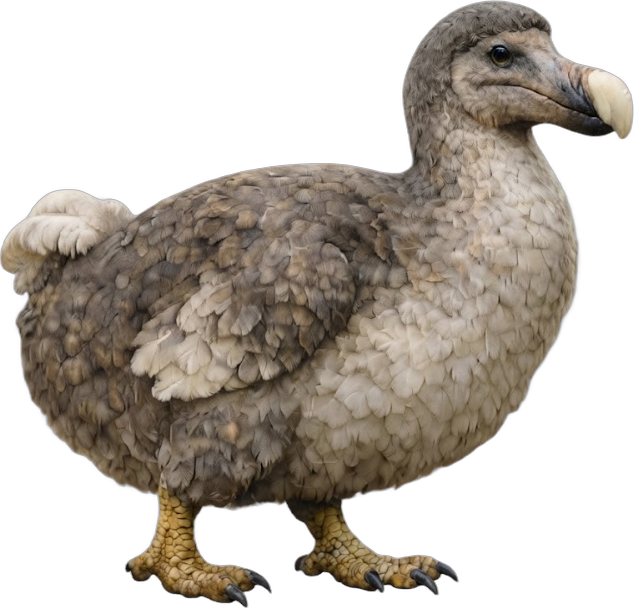 132 animalsIUCN Red List
New · 132 animals · IUCN Red List
Endangered Animals Explorer
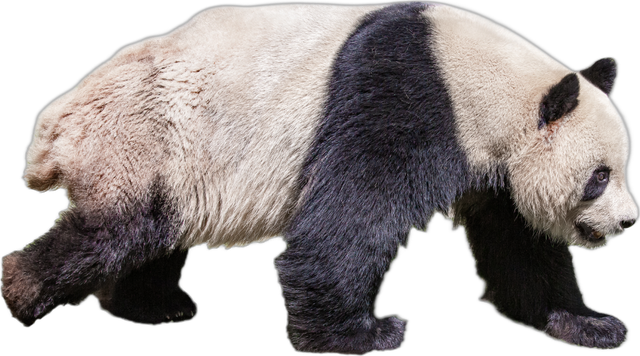
Dive down the Red List from Least Concern to Extinct. See how many are left, what threatens them, and which ones are coming back. Start the dive →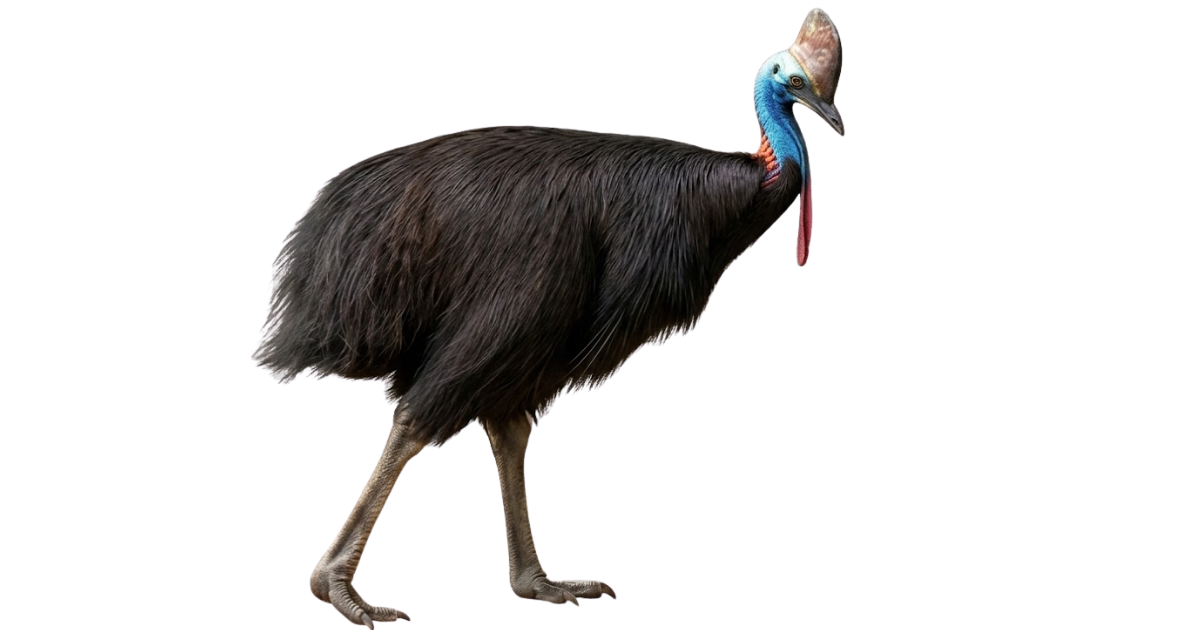 EN
 CR
 NL
 VU
 EN
 ENVUEXENEndangeredCRCriticalVUVulnerableEXExtinct64 animalsEPBC Act + IUCN
New · 64 animals · Australia
Endangered Animals in Australia
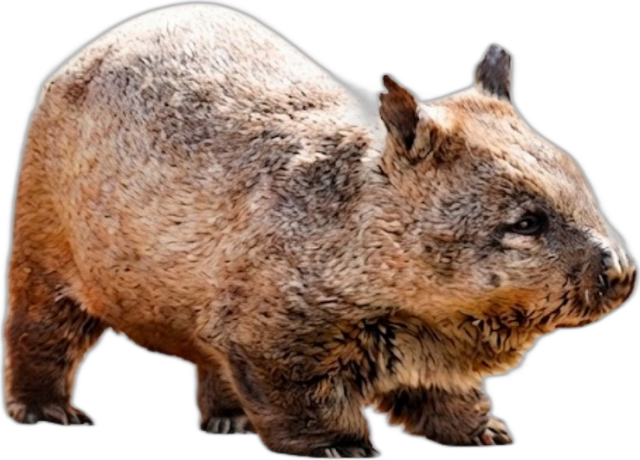
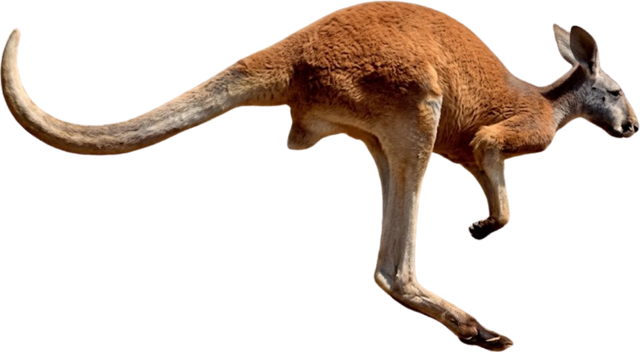
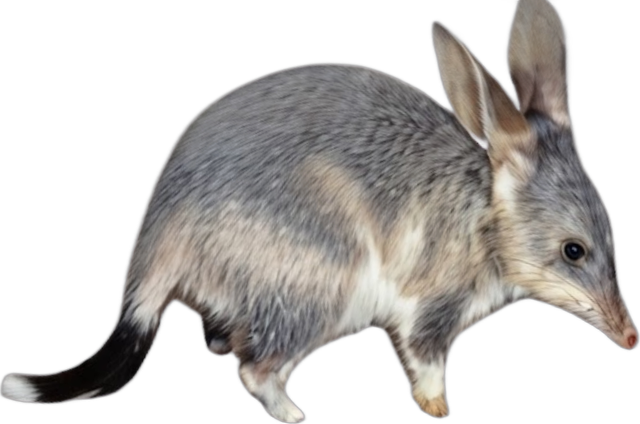
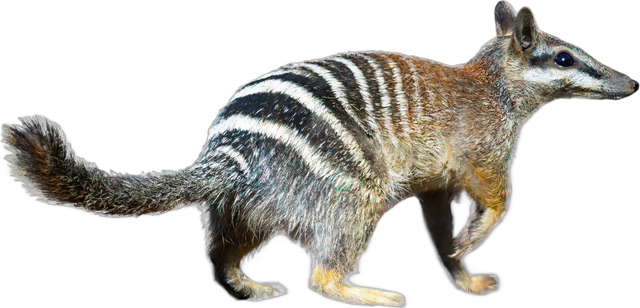
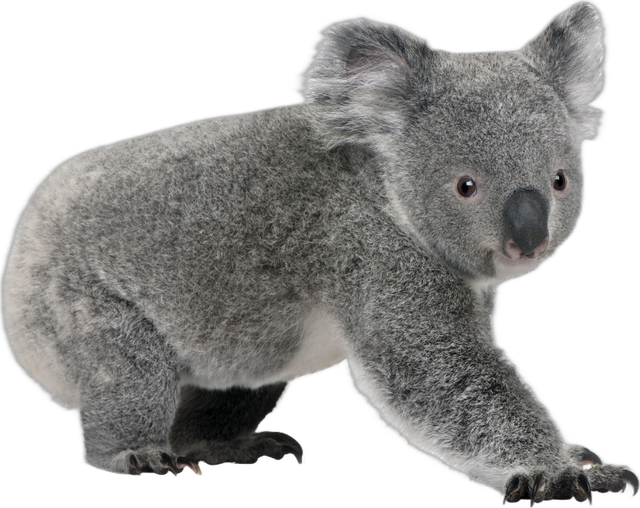
From koalas to cassowaries: rank 64 Australian animals by national law or the IUCN Red List, and filter them by your state. Explore Australia →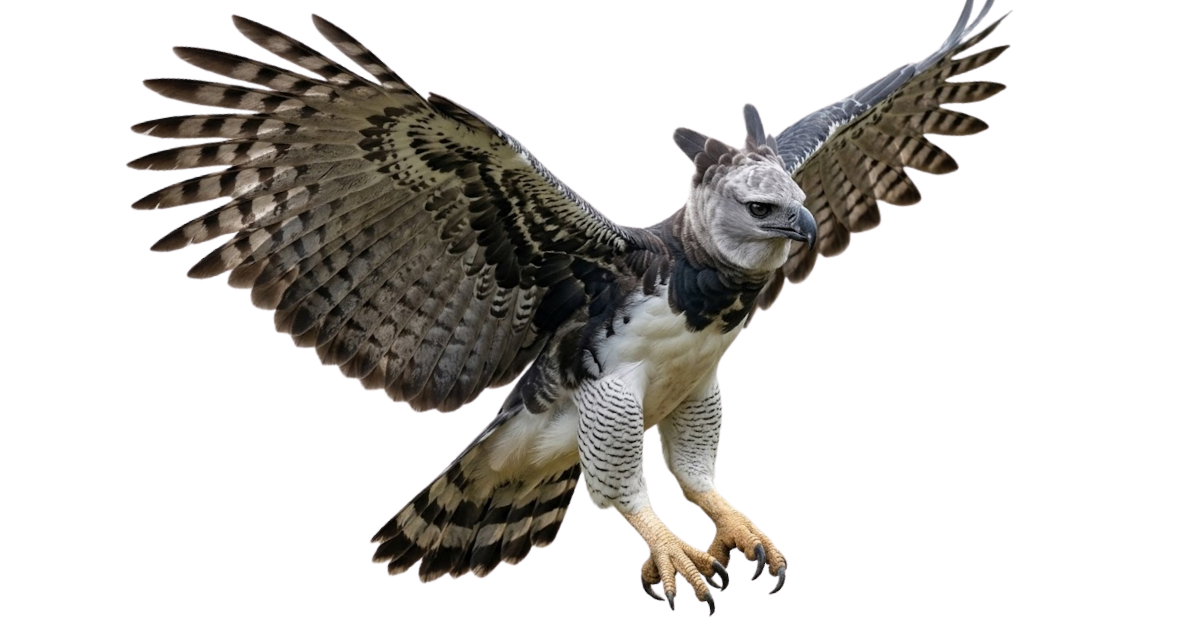
 70 mCanopyFloor
New · 63 animals · 4 rainforests
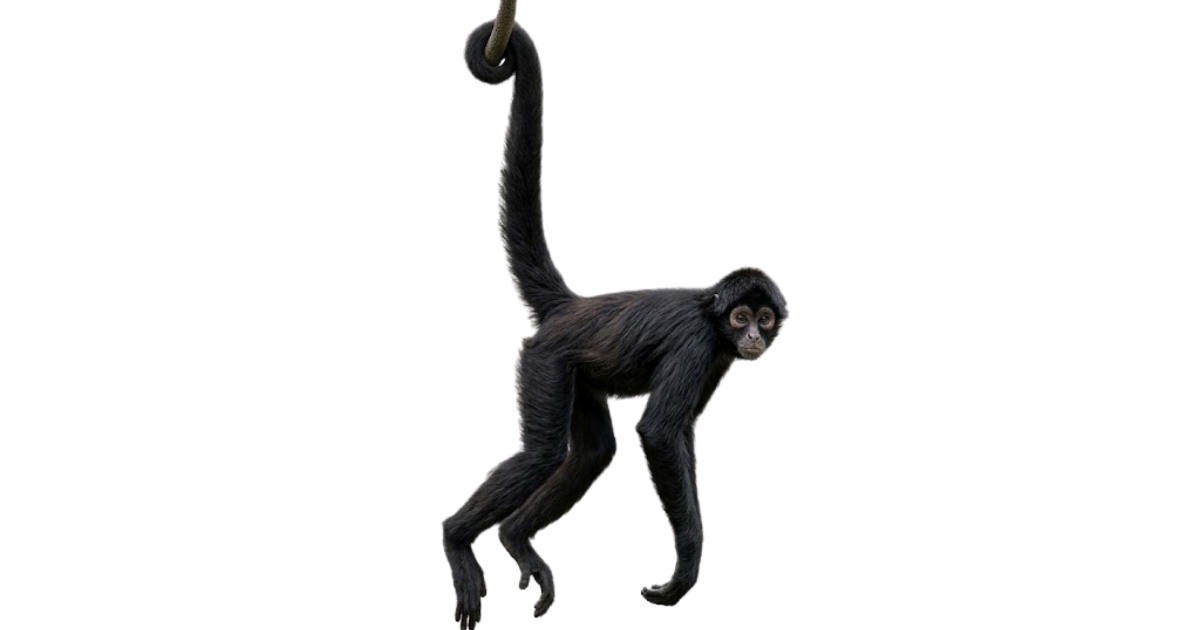
Rainforest Layers
Climb down from the emergent treetops to the river in the Amazon, Congo, Borneo and Daintree. Turn on the jungle sounds, make it rain and log every animal on the way. Start the climb →
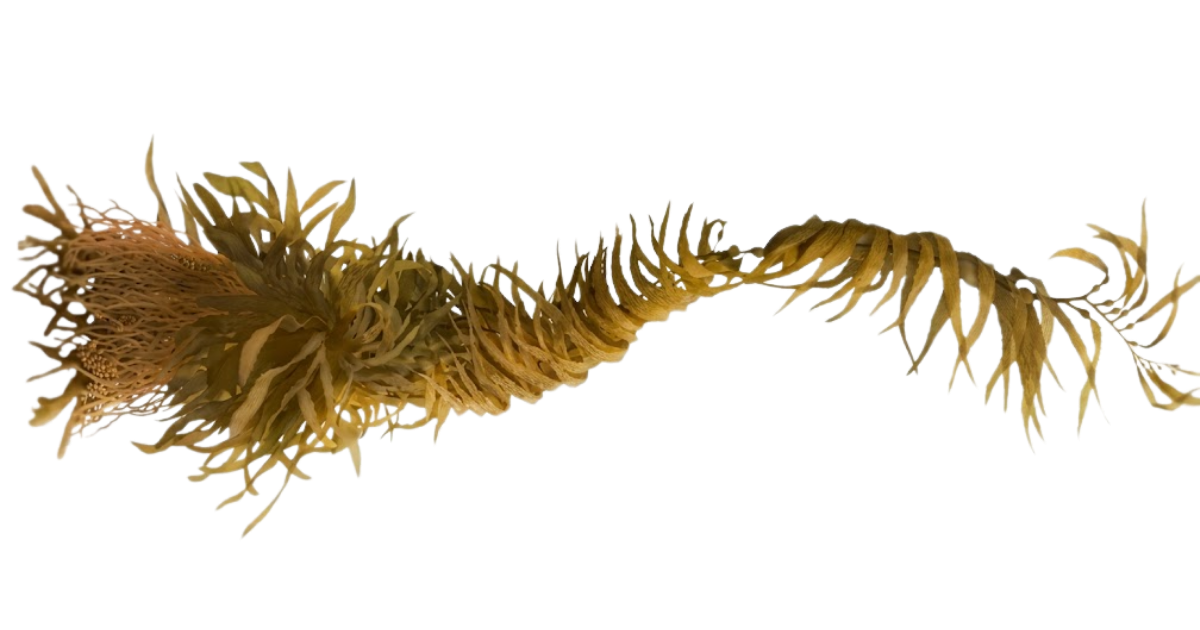
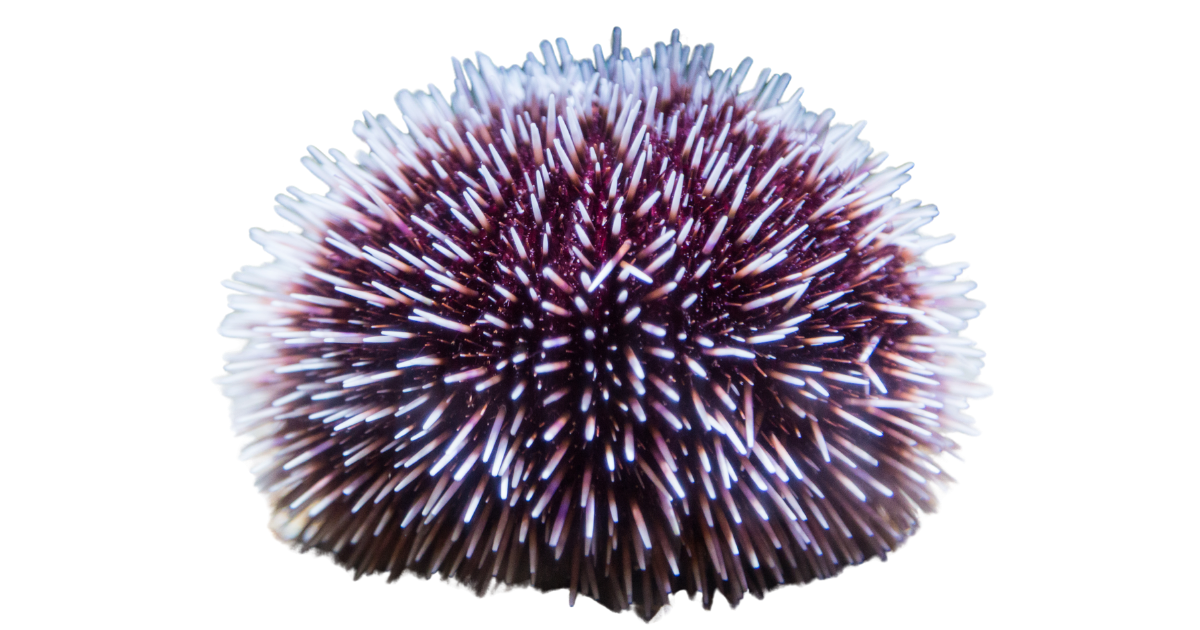
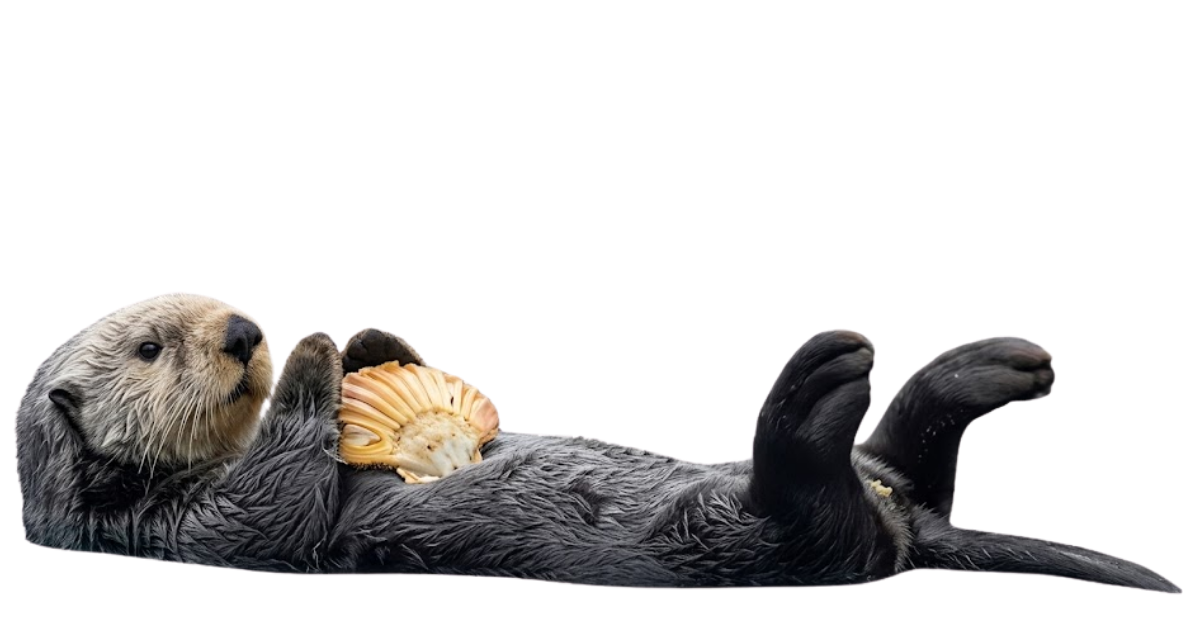
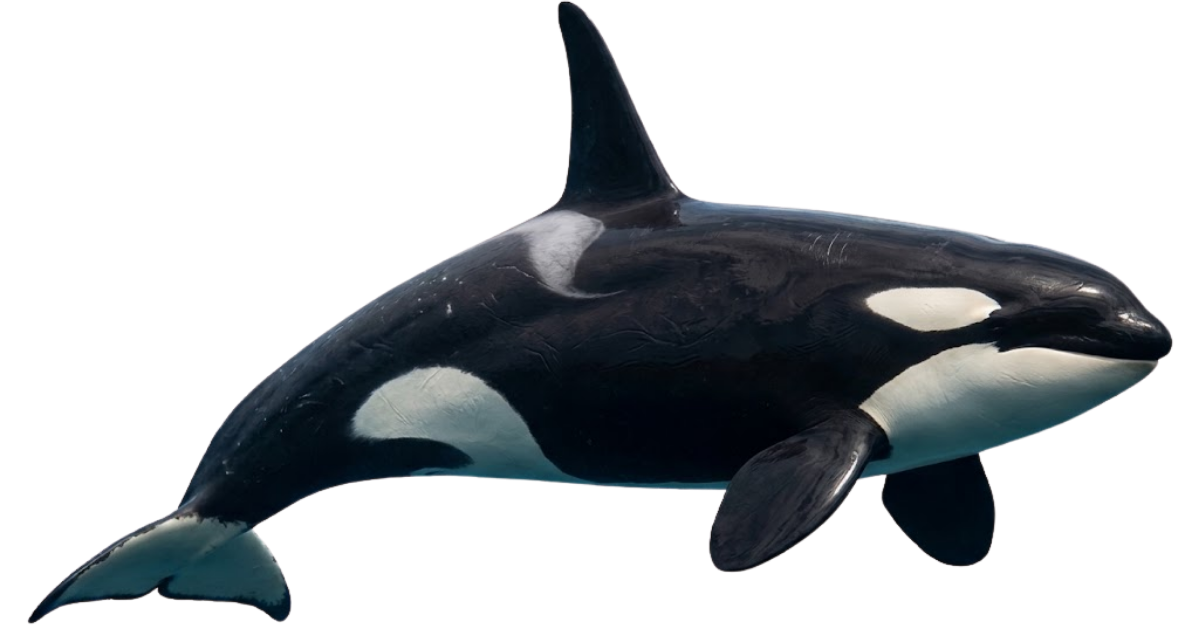 RainforestKelp forestMeadow
New · 46 species · 3 ecosystems
Food Web Game
Trace who eats whom in the Amazon, a kelp forest and a meadow. Build food chains, remove the sea otters and watch the kelp disappear, then take the quiz. Play the food web →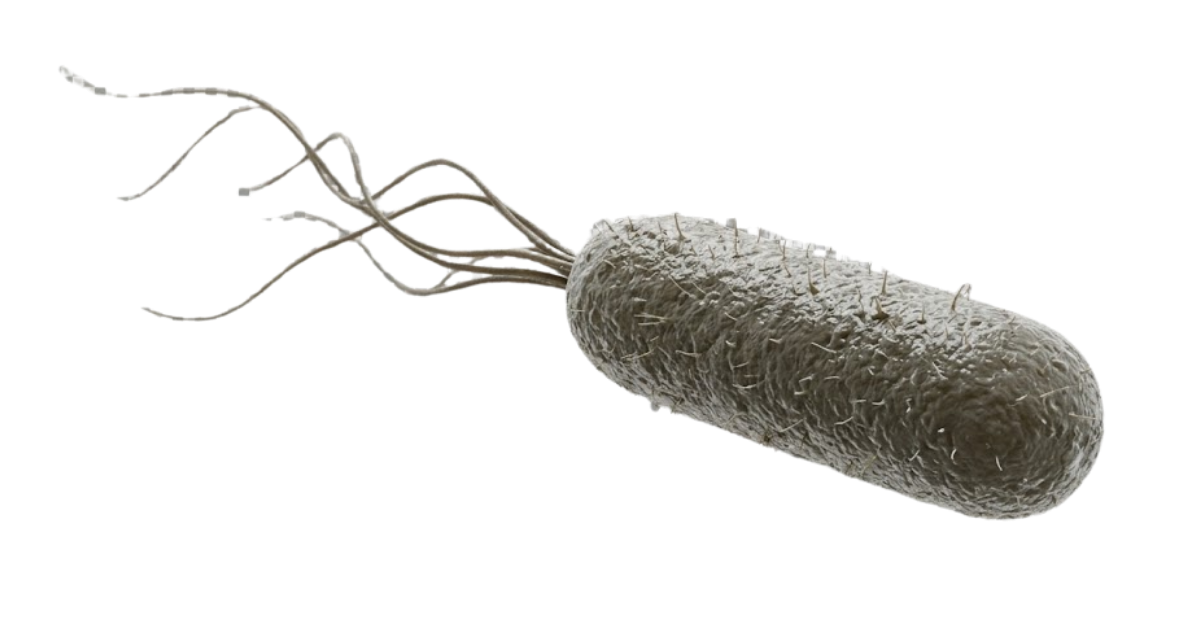
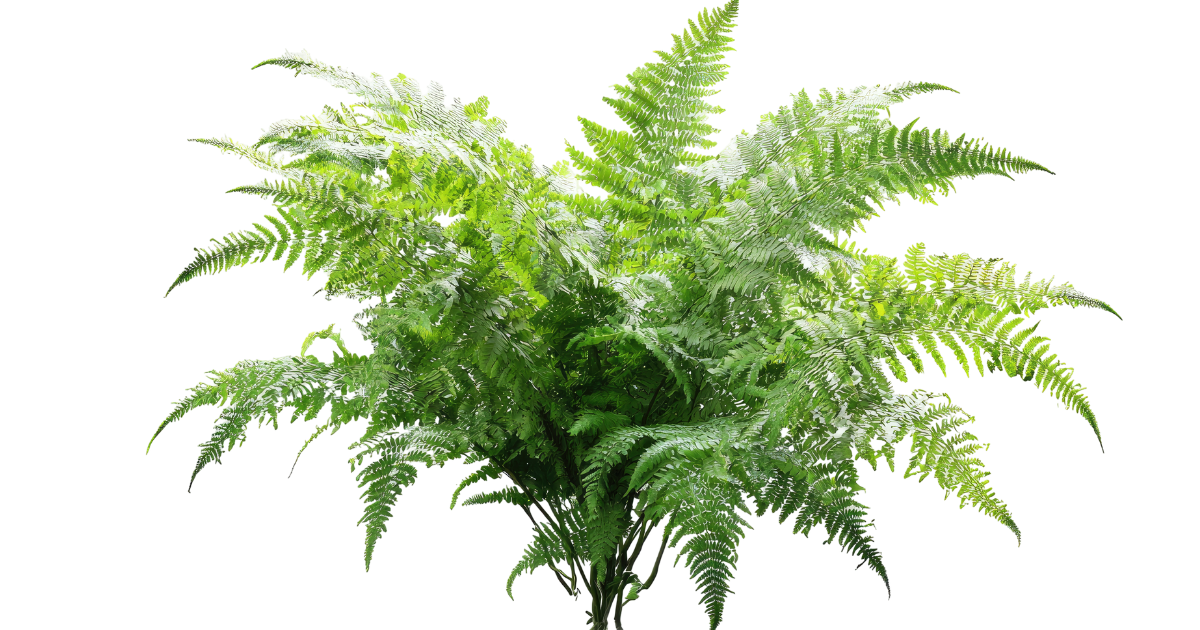
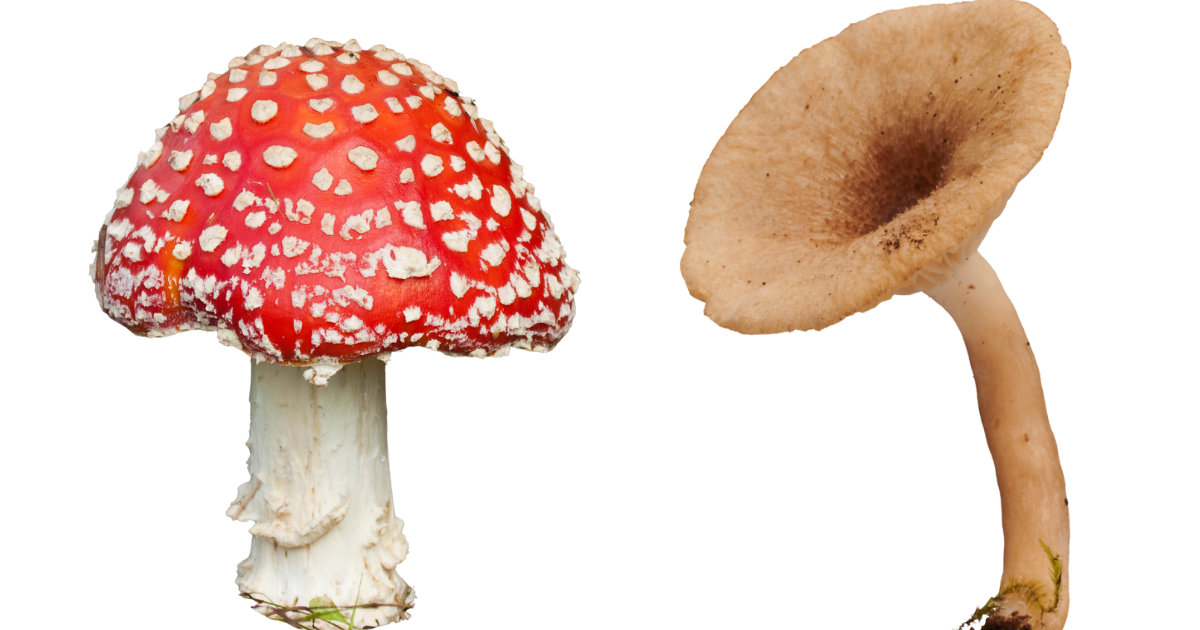
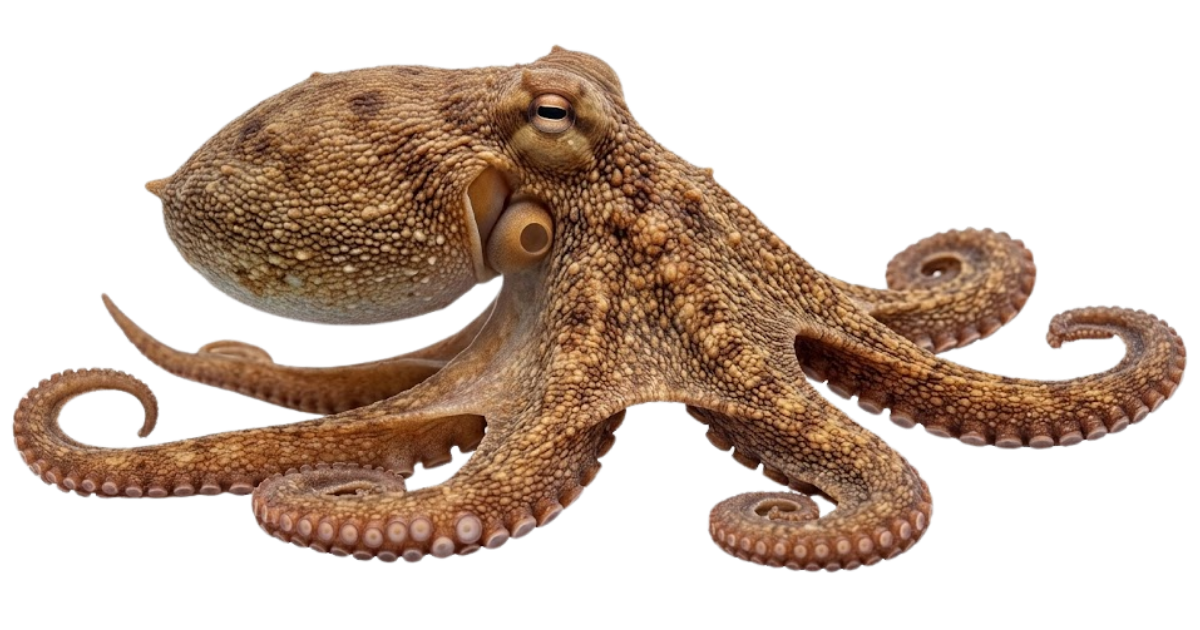 3 domains6 kingdoms4 billion years
New · 49 living things · 5 game modes
Tree of Life
Grow 4 billion years of evolution, zoom into any phylum, classify mystery creatures and find out why a mushroom is your closer cousin than a daisy. Explore the tree → 3D dive61 speciesHeatwave lab New · 3D dive · 61 speciesCoral Reef Explorer
Swim through a 3D Great Barrier Reef, find clownfish, reef sharks and giant clams, then turn up the heat and watch the coral bleach in the Heatwave lab. Start the dive →What the wildlife interactives are built from
Every tool here starts from published data rather than a drawing. For example, the migration maps follow routes taken from satellite tracking studies. Each map opens on today’s date, so you see roughly where the real animals are now. Meanwhile the size comparisons work differently. They measure each animal from a cut-out photograph, then scale it by its real length. Because of that, a whale and a tardigrade on one screen are genuinely in proportion. Almost no illustration manages this, since at an honest scale one of them disappears.
The speed race lines animals up on a 100-metre track against Usain Bolt, with a speed dial and a game. Each size comparison has three ways in: a lineup you can drag through, a head-to-head view for any two species, and a guessing game. The ocean ones also show how deep each whale or shark lives, with the water darkening to match. The deep sea dive and the rainforest climb, on the other hand, work vertically. You scroll down through the layers, and the light, pressure or humidity change as you go. The lifespan chart runs sideways instead, from a mayfly’s single day to a glass sponge’s 11,000 years.
Some figures are contested, or sit at the top of a range rather than the middle. In those cases the page says so. Where an animal has a full guide on the blog, the tool links straight to it. Finally, nothing here asks for an email address.
Built for a phone, and for classrooms
All of it is touch-first. Drag the maps, drag the scale, or tap a species to jump to it. Teachers are welcome to use any of it in a lesson, and several already do. There is no licence and no attribution required, though a link back is always appreciated. If something is wrong, or a species you care about is missing, tell me and I will fix it. After all, I am a conservation biologist. These are the things I wanted to exist while explaining this in the field.